
Today’s business environment is becoming ever more volatile and complex. Market dynamics are changing rapidly and lead times required to respond are weeks or days, not years and months.[bar group=”content”]
Scenario Analysis Allows Management to Easily Understand Changes And How To Respond Effectively
The more your business experiences supply side volatility, demand uncertainty, or both, the more you need to understand their impact and the ability to respond. For that, scenario analysis is a must. Our experience has shown that scenario analysis is a useful tool for Senior Management if it is simple to understand and the analysis is actionable. It helps to understand the potential impact of a change in business, as well as the best way to mitigate/leverage it. To get the most from scenario analysis, we should concentrate on gaining insights within the context of operational constraints and realities, not on evaluating operational details.
An effective scenario analysis:
- Considers simultaneously a range of strategic, tactical, and operational goals and constraints
- Views business holistically rather than by function
- Takes into account the domino and cumulative effect of multiple events
- Keeps everything transparent to be most effective it must do all the above quickly and efficiently. We recommend that the scenario analysis models should run in 10 minutes or less after an update.
What drives scenario analysis? The business needs or questions to be answered. A critical first step in building a successful scenario analysis system is to understand what issues are creating the greatest difficulty for executives and/or what opportunities have the potential to strengthen the company. Then you will know what data have to be collected and how the model has to be configured to meet the needs of Senior Management.
An Example of Scenario Analysis: Sailboat Supply
Let us take an example of Sailboat Supply (SBS), which is a manufacturer and wholesaler of aftermarket spare parts for sailboats. The model for SBS has the following characteristics:
Product Families: SBS has four product families: Blocks, cam cleats, mounts, and swivels. Each family has very different resource requirements, profit margins, and sales volume. A new product family, winches, is in the development phase. Winches are more complex and quite material intensive, but are expected to yield excellent margins. Their preliminary forecast for market demand is fairly strong.
Markets: SBS has five established markets: US East, US West, US South, Canada East, and Canada West. Emerging Markets are in the United Kingdom and Spain. These markets have different growth profiles and margins. Manufacturing: Manufacturing is relatively simple. When bottlenecks occur, they are mostly in molding and packaging. Labor is available in regular shifts, overtime, and by contract.
Raw Materials: Manufacturing considers nine components to be critical since they have very long lead times and/or highly variable costs. Some materials are common across all products, although in different proportions, and some are unique only to one or two products.
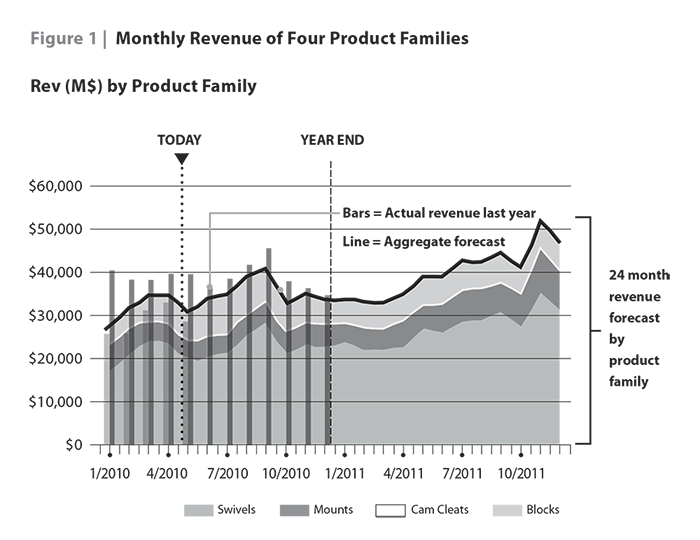
Suppliers: SBS has 13 suppliers for the nine critical components. Three materials have multiple suppliers with differing costs, and lead times as well as minimum quantity requirements. Six materials have unique suppliers. Figure 1 gives 24-month revenue forecasts of all the four product families. It shows that SBS is not having a good year. Revenue of all four families is down from last year.
Integrated Picture Of The Business
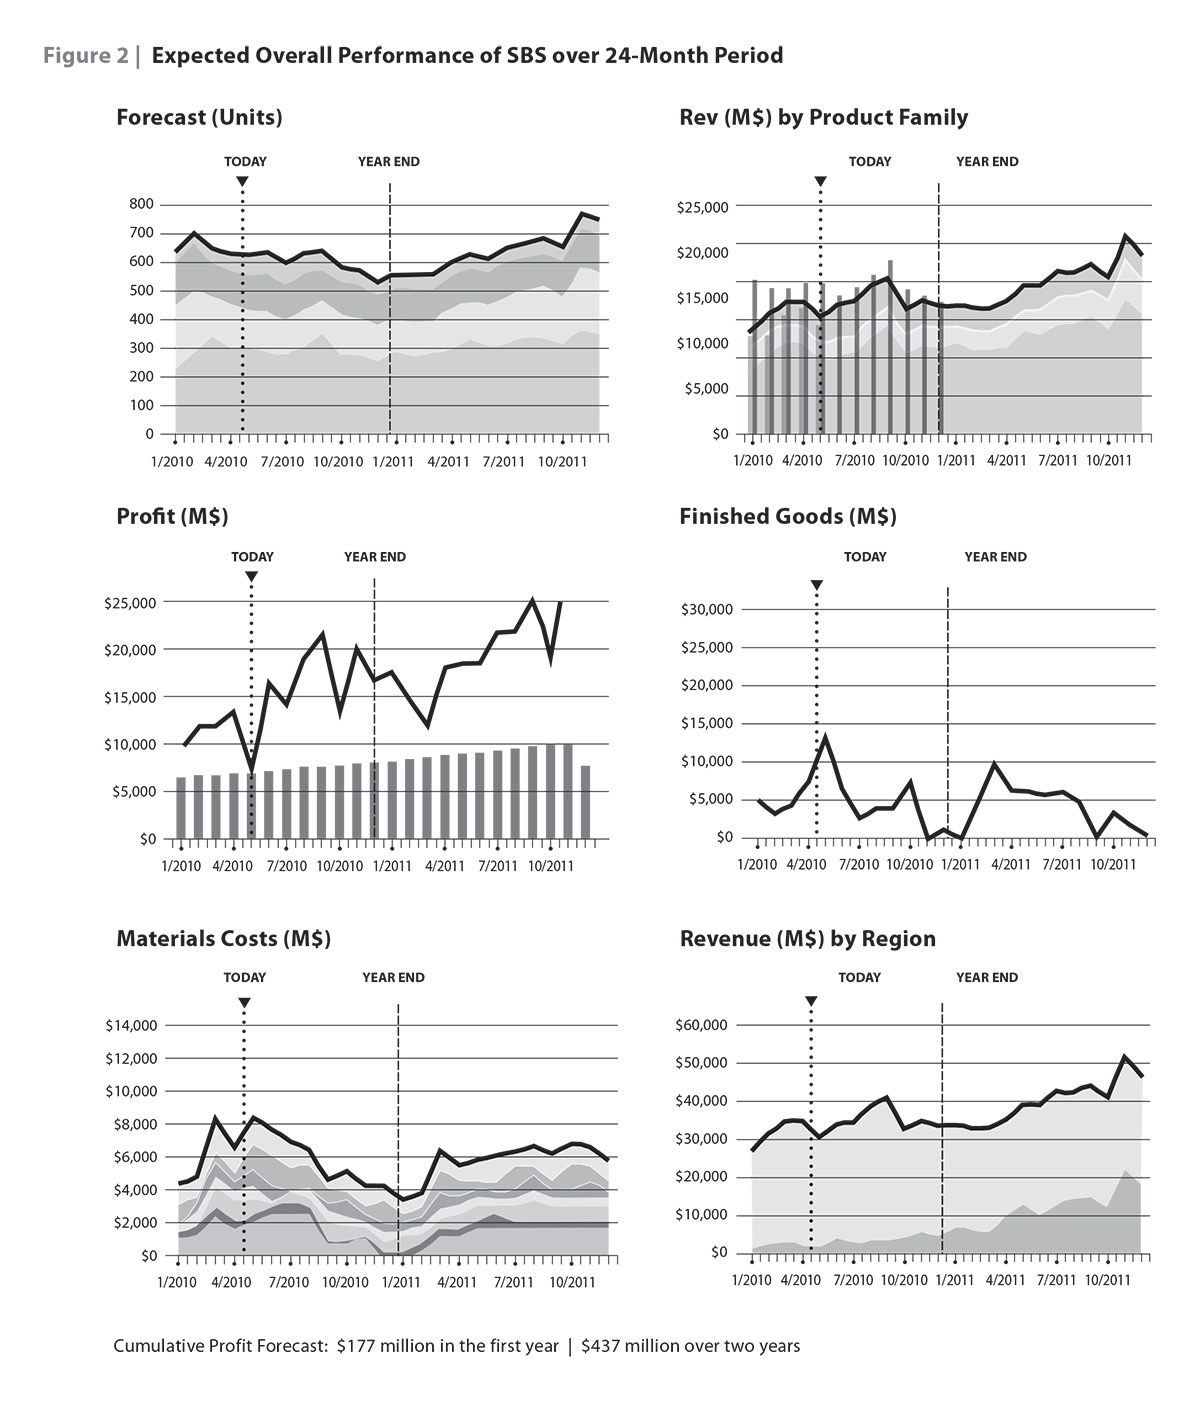
Figure 2 gives an overall snapshot of SBS. The charts show the sales forecast by units and by revenue, as well as some operational and financial numbers based upon the sales forecast. The bars in the profit graph represent the minimum profit target set by Management. Graphs are based on a live model. Operations have been optimized within specified constraints (planning bill -of -materials, materials costs, supplier lead times, minimum order quantities, capacity constraints, labor costs, etc.) to meet demand and the minimum monthly profit target, and to maximize overall profit for the two- year period. The one -year profit and cumulative profit over two years are shown in Figure 2.
Change In Demand
New information comes from marketing showing that the demand for blocks will significantly drop because of the introduction of a new competitive product. If no change is made in purchasing and production plans, the profit is expected to drop to $155 million in the first year (12% decrease from the earlier forecast) and to $270 million over a two year period (38% decrease from the earlier forecast). The situation is not bad in the first year because it still yields profit above the minimum set by Management. However, the profit over the two- year period does not look good, because it is much below the minimum target. After revising the purchasing and production plan based on the new forecasts, the profit of the first year comes to $161 million (4% higher than the previous estimate) and to $334 million over a two-year period (24% higher than the previous estimate).
What Can Planning Do To Improve Business Performance?
Management is not content with these profit numbers. Now the question is this: What options does SBS have to improve business performance especially next year? Here are the options:
New Product Launch: The VP of Marketing suggests that SBS should launch the new product family of winches sooner than originally planned. This product line will not only dramatically increase the overall revenue stream but also provide excellent profit margins. Management requests the S&OP team to investigate it. The S&OP team sets up the model to call for the launching of winches, but lets the optimization engine pick the timing of that launch.
The results from that optimization were surprising. Profit is projected to grow but not nearly as much as anticipated. The cumulative profit of the first year will rise from $161 million to $165 million (2% increase). Over the two year period, profit will rise from $334 million to $362 million (8% increase). The drill down analysis shows that SBS does not have the capacity for such labor and material intensive products. The launch of winches requires ordering more material, which would come from more expensive suppliers, and use more expensive outsourced capacity for some of the molding process.
The S&OP team makes the following recommendation to Senior Management:
- Rebalance operations due to lower demand.
- Continue to develop the marketing plans necessary to launch winches, and evaluate cost and financial impact of a capacity upgrade and new suppliers.
Range Forecasting And Contingency Planning
While Manufacturing is searching for better logistics, costs, and timing of a capacity upgrade, Marketing is not resting on its laurels. They realize that a new relationship with a major distributor, which has been talking with SBS about carrying some of its product lines, might provide a significant boost in sales for winches. After discussions with the distributor, the S&OP team creates a higher demand forecast with some necessary marketing and promotion recommendations. Further, the team determines that with this demand scenario an additional capacity upgrade will be needed.
Presenting Scenarios At The Senior Management Review
At the next Senior Management Review, the S&OP team offers two scenarios: One, there is a 70% probability that the new distributor will not sign the contract within four months. To meet this level of demand, the required capacity upgrade will cost $2 million and the store rebate that needs to be offered will cost $1.5 million. In this scenario, total company profit will be $177 million in the first year, and $393 million over the two year period. Two, there is a 30% probability that the new distributor will sign the contract. In that case, capacity needs to expand even further, which would cost an additional half million dollars. Also, further expansion of promotion would be necessary for the next six months, which would cost half a million dollars. Here overall profit is expected to be $180 million in the first year and $410 over a two year period. Management decides that given the strong long range demand forecast for winches and the importance of the potential relationship with this new distributor, SBS will proceed with the second scenario.
As we all know point forecasts of the future are by definition wrong. However, in eight months when the new distributor signs on with SBS, management feels they are well positioned for this new opportunity and have made an informed decision based upon their understanding of alternatives and trade offs.
Concluding Remarks
Every decision about the expected demand impacts supply as well as profit and revenue. The beauty of scenario analysis is that it not only translates the outcome in terms of volume and units, which Sales and Operations Management wants, but also in terms of profit and revenue, which management wants. The example here is simplifi ed. But scenario analysis is a powerful tool. It provides visibility into the future, enables one to act proactively, and helps to build a sustainable and profitable business. As business has become more complex and diverse, planning methods have to keep pace. In the past, all that was necessary to run a profitable business was to have a good product and operate efficiently. But now companies must open new markets through product innovation, keep customer service levels up even in the face of highly uncertain demand, and deal with complex supply chain issues. Scenario analysis techniques provide a systematic way to make decisions about complex issues. They can help us evaluate different courses of action based on what we want to achieve and when, and how we want to measure the outcome.
As published in the Spring 2012 issue of the IBF’s Journal of Business Forecasting (JBF). All Rights Reserved.