Most forecasts and demand plans assume that market behavior will remain the same to a certain extent in the future. However, the causal factors influencing demand could easily change, rendering our demand plans inaccurate. Using historical patterns therefore, is not always the best way to predict the future.
Hence, in addition to historical patterns, a structured methodology that monitors and addresses key causal factors impacting demand will facilitate greater forecast accuracy. This in turn serves the larger purpose of gaining competitive edge in the market via better customer service, optimum working capital management, improved revenues, and profits.
Causal factors are key drivers/variables influencing demand. These variables include marketing initiatives, weather conditions, macroeconomics, channel inventory, and more. Changes in these causal factors result in forecast delta (change) and error (forecast inaccuracy). Since these factors are critical to effective business forecasting, it is essential for Demand Planners to record, track, and evaluate them in a structured and effective manner.
However, sailing into an ocean of demand data for any analysis is a challenging task. Getting relevant feedback from commercial teams to create demand profiles is difficult. Also, we are often hindered by a lack of forecasting software and other resources. To deal with the vast amount of data we hold, we can use segmentation to identify products we want to dedicate our limited time and resources to.
Demand Segmentation
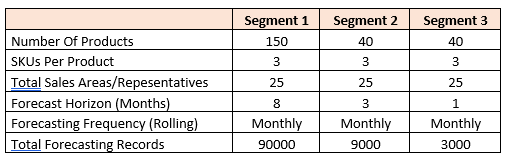
Segmentation plays a crucial role in prioritizing data. Let’s say our company has 150 products but we cannot forecast effectively for all of them. To better use our time and resources, we can segment by product, customer, geography and other criteria. Table 1 shows product segmentation based on profitability. We start off with 150 products and 9000 forecasting records. Segment 2 cuts this down to 40 products. Segment 3 then cuts the forecasting horizon from 8 months to 3 months to reduce the number of forecasting records we have to analyze.
We do this because identifying causal factors for an 8-month forecast horizon is harder than a 3-month horizon – the shorter time horizon makes it manageable. You’ll see for Segment 3, that with the reduced forecast horizon, we have reduced the total forecasting records from 9000 to 3000. With this reduced number, we can now identify the causal factors impacting them without being overwhelmed.
Table 1: Forecast Universe (forecast records)
Framework To Record & Analyze Causal Factors
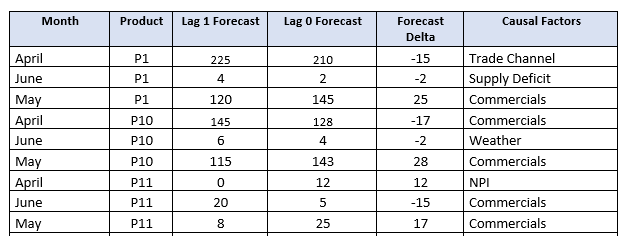
For the shortlisted products, you can plot the following table indicating the causal factors affecting demand for products monthly. We ascertain the validity of the casual factors by collaborating with commercial teams who have insight into what is behind demand variation. Perhaps they implemented a marketing campaign or unseasonal weather spiked or crashed demand.
Table 2 contains the Forecast Delta (i.e. the variation between Lag 1 forecast vs Lag 0 forecast) and the major causal factor influencing the forecast delta. Try to keep the list of these factors limited to 6 to 8 based on product, market or customer attributes. They can be further bifurcated as internal or external factors.
Table 2: Framework recording the causal factors behind demand variation
Benefits Of Recording & Analyzing Causal Factors
You can use this framework to identify what impacts demand and, subsequently, generate better forecasts. Once you have recorded the causal factors, bifurcate these into internal/external or controllable/uncontrollable. In the Demand Review, reveal the sales volumes being forecasted and why. Validation of these driving factors in the Demand Review will result in a consensus-driven forecast where the assumptions behind demand are agreed upon by all stakeholders.
Sales and Marketing can validate or challenge the assumptions behind your forecasts and, when armed with the forecasts, can plan their own initiatives according to their own goals. Our colleagues in Supply Chain, Production, Sales, or Finance can also then respond appropriately.
Then take these key inputs to the Executive S&OP meeting. Interpretation of the data is the priority here, with easy-to-digest insight that facilitates decision making. As the saying goes “A good decision is based on knowledge and not on numbers”. Below is a sample layout to display in the Executive S&OP meeting.
Chart 1: Indicates the contribution of causal factors to demand variation
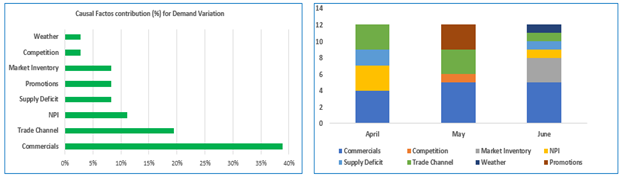
In Chart 1, Commercials is indicated as a critical factor impacting demand, followed by Trade Channel. Tables and Charts are plotted In Excel with simple conditional formatting. Message me privately on LinkedIn with your email address if you would like this Excel template.
The insights presented therein will enable your management team to address factors impacting demand variation. In this example, Commercials contributes significantly, and Management can take steps to control such factors in the future.
Key Takeaways
- Forecast accuracy is not the goal but a means of achieving enterprise-wide goals.
- Forecast accuracy should be considered an Enterprise KPI (not limited to any function or role).
- The purpose of this framework is to track demand variation factors and to effectively address them.
- Demand segmentation is vital when understanding causal factors for multiple products.
- A feedback mechanism from the commercial/sales team is a critical part of such a framework to validate causal factors.