The BASF Group’s Intermediates division develops, produces and markets a comprehensive portfolio of about 700 products for coatings, plastics, pharmaceuticals, textiles, and more. Crucial to the success of this operation is Demand Planning and Forecasting. We have a best in class Demand Planning organization that sets the industry standard for best practices. Here I’ll reveal our process, and the small changes we have made that driven significant results.
The Demand Planning Process at BASF
Our Demand Planning starts with robust statistics that are generated with state of the art models in APO Demand Planning and R. Our statistics are of a high enough quality that we typically don’t have to modify them before inputting them. In cases where statistics must be modified to develop an effective forecast, they still serve as a viable baseline reflecting historic sales and trends. Statistics also serve as a time saver, replacing many manual efforts.
Once this is done, Marketing and Supply Chain hold Validation meetings, where forecast discussions take place, looking at every perspective, including collection of additional data from other stakeholders, forecast methodologies vs. accuracy, forecast value add, error, bias, effect on inventory, effect on delivery metrics and continuous improvement.
The process is also examined strategically, with process improvements arising from lessons learned over the years, best practices and state of the art thinking. Evaluation is quantitative and part of the discussion. Forecast accuracy and cumulative error are mainly used, but other metrics are used as well, sometimes on an ad hoc basis to address difficulties.
Our division uses one set of numbers, with Marketing committing in terms of a financial forecast, with Supply Chain’s using the same numbers for production, supply, operative inventory and delivery.![]()
The Unique Forecasting Challenges At BASF
The main forecasting challenge we face is our position in the Value Chain. We are further up the Value Chain from Retail and the Consumer. Many of our Customers are also intermediaries in the process of manufacturing consumer goods. This makes us subject to the activities of our Customers, such as inventory increases/reductions, minimum and economic order quantity adjustments and financial strategy changes. At our position in the Value Chain, these can affect sales as much as Consumer behavior. We are also sensitive to the Bullwhip effect, with slight Retail changes causing much greater changes on our end. All of these are major considerations for our forecasts.
Even though process-wise we have met many challenges by streamlining and carefully analyzing data, POS data and multi-tiered analysis are less valuable to us than they are for businesses further down the Value Chain and closer to the Consumer. So what information do we have that is valuable, and how do we use it?
Structuring Qualitative Data
In any Demand Planning process, there must be a quantitative way to evaluate and add information for new products, new customers, increased demand and potential upside, even though the sources of information are vague and qualitative. But without the benefit of POS data and Social Media, where does that information originate, and how does one quantify insight gathered from things like discussions? How do we decide if that information is correct? We can give a probabilistic value to quantitative data, but doing so with qualitative data is rather more difficult.
To add to the complexity, we included insight from past discussions on the probability of making additions to the product range. With differences of opinion about how certain one needed to be before changing a forecast to include speculative changes, this became a difficult process. Combined with a fear of wasting capacity, there was no clear process of how certain one needed to be that a sale would be realized before adding to the forecast.
This led to stakeholders using the forecast to hedge inventory for future sales, a methodology which may not be based on customer related information at all. This wasn’t what we wanted.
In turn, some forecasts generated error with high cumulative error and bias. This directly contributed to increased inventory and affected other metrics including delivery reliability, because the increased production of over-forecast products used up capacity that was needed for others.
The fear of wasting capacity, as well as pressure to forecast to capacity (whether logical from a sales perspective or not) caused further confusion. We clearly needed a solution that addressed the certainty of a sale vs. forecast. The solution also had to address the fears of exclusion as well as the effect of unreliable information on forecast accuracy. By using traditional forecast theory, our division was able to quantify information from discussions that previously presented challenges.
Gauging Certainty Of A Sale As A Function Of Time
Forecasts are less accurate as one moves forward in time, so it stands to reason there is less certainty in a forecast a year from now, than one that is used for production in the upcoming month or two. From this information, a guideline was developed to gauge the certainty of a sale to be included in a forecast as a function of time. (See Figure 1)
Figure 1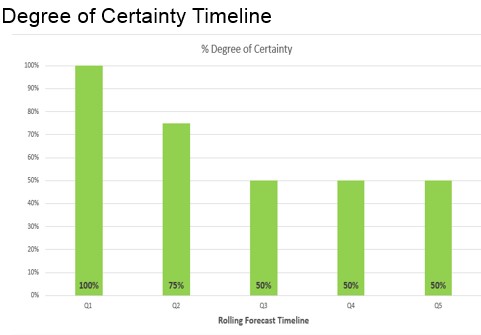
Forecasts in the near term are required to be 100% accurate, using confirmation from the customer. As we move further out in the timeline, a greater measure of speculation is allowed. The timeline was developed to be easy to use, easy to interpret by Marketing, and to produce accurate results.
Since we use one set of numbers, the inclusion in the operational forecast automatically meant alignment with the financial forecast. By establishing a process for quantifying insight gained from discussions and using Customer/Sales information, we no longer had to hedge inventory.
In the final analysis, the most experienced forecasters were following these guidelines all along. What was missing was definition and documentation. This clear definition of how uncertainty is handled in our forecast process not only benefited the less experienced forecaster, but changed perceptions for observers and users of the process, who thought the issue was inadequately addressed.
Conclusions
Even in the most robust of processes, small changes may have an effect on the overall results. At BASF, the way that certainty of a sale was viewed in the past was undefined and varied. Making a small change to the process, and defining the degree of certainty necessary to include in the forecast as a timeline, changed the way the forecast was developed and viewed. This exercise refined the way we will view process improvements in the future.