Last week we looked at cutting inventory through improving inventory quality (getting rid of obsolete or low value stock) and reclassifying mislabelled inventory. Once you’ve done those those 2 quick fixes, the next inventory cutting initiative is testing for forecast bias and reviewing products in transition. Like last week’s Quick Hits, these will yield fast results without much in the way of research, tools, or infrastructure changes. Removing forecast bias should yield measurable inventory reduction results in just two to three months.
Testing for Forecast Bias
Forecast bias is a problem in many organizations. The perpetual challenge in demand planning is to balance the aspirations of Sales and Marketing with reality as reflected in consumer sales and factory shipment trends. When aspirations consistently exceed the reality, bias is the result.
Supply chain planning typically begins with a forecast, and if it is overstated it creates excess inventory. Conversely, consistently understating a forecast (or “sandbagging”) causes a bias as well. This can lead to expediting, schedule cuts, and other detrimental supply chain behaviors. While targeting bias seems to be the realm of a longer-term forecast improvement project, measuring forecast bias often drives fast and significant change in both inventory reduction and forecast error levels.
Measuring bias requires only a modest effort, usually focused on report building, and can be implemented in a relatively short period of time. It’s a perfect quick-hit opportunity. For those not already familiar with measuring forecast bias, there are a number of different ways to calculate this metric; our experience suggests that simple rules are the best. One quick test is to track any item that has been over or under forecasted for three months in a row (in the same direction).
A directionally biased item becomes a ‘problem item’ if the average deviation or error over the same three months is greater than 25%.
Identifying Problem Items
If this is your first venture into measuring bias, you should expect 60%-70% of all items to have some level of directional bias. Of course, it may be impossible to track bias for a potentially large number of items, so you may want to manage the bias measure by exception, using a secondary filter to reduce the list of bias items to those where the directional bias is most significant. The typical secondary filter is aggregate error – the summing of forecasts and actuals to arrive at an error percentage over the course of three months. In one of the simplest implementations, a directionally biased item becomes a ‘problem item’ if the average deviation or error over the same three months is greater than 25%. Again, this is a simple rule of thumb that may not apply well to all businesses.
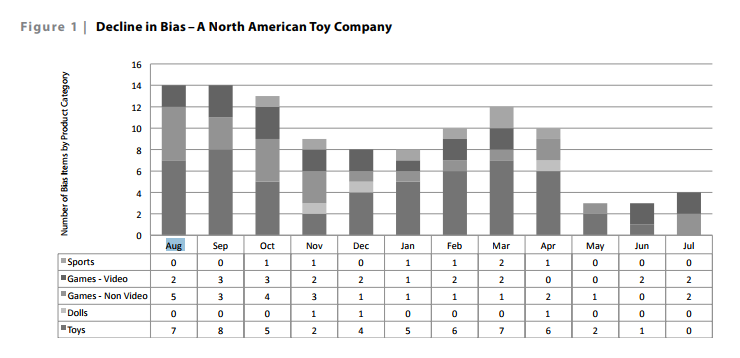
As you might expect, the number or percentage of biased items is a meaningful S&OP measure. Figure 1 shows the number of biased items (problem items) above a 25% error threshold on a two month lagged forecast with three months of consecutive directional error. Making biased items a key measurable in the forecasting process improves the quality of a forecast. In turn, a better quality forecast is more likely to help drive down inventory levels.
Once you work through some of these questions, you may present the bias information in your demand consensus process for root cause analysis and correction
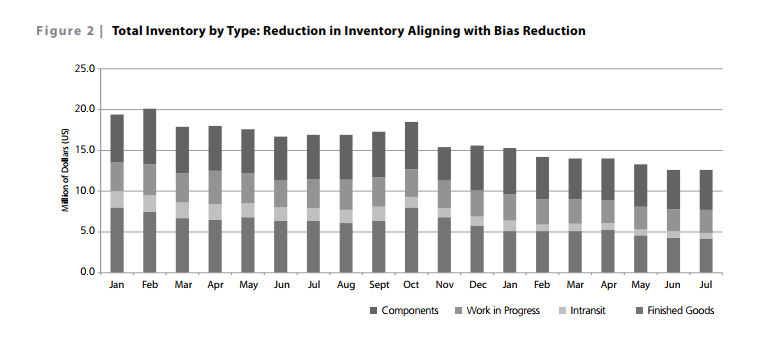
Figure 2 shows how the total inventory level (and specifically the finished goods inventory) dropped significantly over the same time as the number of bias items was lowered. This works, and it works well. So, how do you get started? First, you need to create a bias measure that works for your company. Looking at historical data can help you determine the number of directional forecast misses over time. You will need to determine a relevant level at which to test for bias in an item, brand, product grouping, or category, and/or what percentage of a miss represents bias for your organization. Most business leaders start with 25% as a measure, and then shift the percentage up or down depending on what they think is best for their organization. Once you work through some of these questions, you may present the bias information in your demand consensus process for root cause analysis and correction. Implementing a simple test for forecast bias can pinpoint unmet aspirations within a forecast and help you quickly reduce inventory levels within 2 to 4 months. Again, this is one of those cases where measurement can help change business behaviors.
To actually reduce the inventory, the best strategy is to create a report of biased items, review them in a demand consensus meeting, and then report them in the Executive S&OP meeting for an appropriate action. Clearly explain that the data reveals bias and is causing excess inventory and a drag on profitability, using the hard data in the report to support your argument.
All too often, product portfolio decisions are made without facts or are based on simplistic rules or metrics such as annual revenues.
Keep an Eye on Products in Transition
As items progress through the normal product life cycle of introduction, growth, maturity, and decline, there is a need to constantly evaluate how these products are planned. Each phase brings its own expectations. A product at launch needs a great deal of inventory and flexible capacity because of the uncertainty of demand. Items at maturity or in decline need their inventory to be optimized as demand is much more certain and reserve stock is not needed. Inventory is at greatest risk during the early introduction phase and in the later phases of decline— often called the long tail of the product life cycle—where sales volumes have dropped so low as to be considered for discontinuation, either through a voluntary market withdrawal or by the loss of a key customer or two.
Product Rationalization To Cut Low Value Items
There are two challenges in managing inventory throughout the long tail. The first is correctly determining product rationalization, that is, deciding which products should stay in your portfolio and which should be discontinued. The second challenge is managing the exit of those products slated for removal. In some industries, products move through life cycle phases seemingly in the blink of an eye. Yet even in industries that specialize in introducing new and improved products each year, it is not uncommon to find poorly defined processes for anticipating/ determining and managing product discontinuation. Likewise, the processes for managing planning parameters that determine inventory utilization through the end of the product life cycle are often equally deficient.
Portfolio management meetings address items as they transition through all phases of the product life cycle—from the ideation to discontinuation
Portfolio Management Review Meeting Should Control Excess Inventory
To meet these challenges, some S&OP process models include a step called the portfolio management review meeting. Within these meetings, the product portfolio is discussed in detail, including discussion regarding current ideas for products as well as those that are in the launch phase. If your firm’s S&OP process doesn’t include such a meeting, you should consider instituting one. Portfolio management meetings address items as they transition through all phases of the product life cycle—from the ideation to discontinuation. A monthly dialogue on the product portfolio can be an enormous leap forward in providing a forum for tracking product strategy and execution. Within portfolio management review meetings, many firms are beginning to use detailed analytics to properly target items for deletion off the long tail. All too often, product portfolio decisions are made without facts or are based on simplistic rules or metrics such as annual revenues. Using a rigorous approach to identify products for discontinuation on an ongoing basis enables the company to shorten the supply while facilitating effective management of obsolete inventory. Once a product is identified for potential discontinuation, supply planning assumptions such as fill rates and batch sizes can be tuned downward to reduce raw and packaging inventory exposure and risk during the final run-out.
Reviewing Stock Levels For New Products Is Crucial
Managing the supply planning parameters during the course of a product life cycle is particularly important. As an example, at one consumer products firm it was commonplace for supply chain planning to carry an additional 35 days’ worth of forward coverage inventory for all new product introductions after the initial pipe fill. The company intentionally carried excess inventory at product launch because of the uncertainty about demand early on. The company was more concerned about having available inventory to support a successful launch rather than the holding cost.
As you might expect, there were multiple examples where this supplemental-coverage inventory was never adjusted downward during the post-launch because there was no process in place to routinely review planning parameters. Under normal circumstances inventory targets are reduced to standard, steady state coverage levels, but with personnel changes and focus shifting toward the next new product launch life cycle, these planning parameters are overlooked, resulting in excess inventory.
Keeping An Eye on Products in Transition requires at least a quarterly review of planning parameters for all products less than two years past the launch phase while also conducting a similar examination of those items nearing the end of their run. Special attention should be reserved for products on the long tail of their life cycles, since these items need focused corrections in their planning parameters as their demand recedes. The adjustments in these parameters should be made with a goal of limiting inventory exposure in the event the market collapses for a product or if key customers drop the product completely.
This is where a portfolio management review meeting can add tremendous value in anticipating and managing slow and no-turn inventories. Many companies review each and every planning parameter, at least once a year. This should be the minimum review. If your company does this, great! The quick hit opportunity in this case is a very detailed one time review of all inventory policy settings for both finished goods and components.
These two initiatives are quick and highly effective. Despite minimal effort, they can resolve systemic problems that place cost burdens on your company. Next week, we’ll be looking at Waste and Yield Percentages and QC Hold Time. Stay tuned!
—————————
This article has been adapted from the Journal of Business Forecasting and Planning, Fall 2011 issue. To receive the Journal of Business Forecasting and other benefits, become an IBF member today.