Web 2.0 is a term that’s been used often since the early 2000s. While the itself term is ambiguous, it has in many ways come to mean the socialization of the web. Compared to the static data put up by programmers back in the day, Web 2.0 is the connection of people – a new world of content being consumed and messages being communicated.
Everyone has seen the statistics – over 90% of today’s data was in the past two years. Think about how many website clicks, interactions, and consumer transactions are being created every day. Consider the 300,000 social media status updates, the 140,000 photos uploaded, and the 500,000 comments made every minute. Add to this the Internet of Things with its constant real-time transmissions, and you’ll have a good appreciation of the speed at which data are being created.
Harvesting this information can be a gold mine for organizations and a game changer for business forecasting and demand planning.
Predictive analytics is helping us unlock the keys to social data and web 2.0. Traditionally demand planning is focused on sales forecasts, generated using only internal order history and data. Much of this history is over 3 years old. This means that many companies are missing out on over 90% of the data available and insights included in it.
More and more demand planning teams over the past few years have migrated to predictive analytics and deriving faster and better results. They are moving to the next stage in demand planning and meeting the current revolution in social media and data. And the results are measurable improvements in forecast accuracy and consumer behavior.
Improving Forecasts With Social Media Data
In one study, Antonio Moreno, Associate Professor of Business Administration at Harvard Business School, looked at data from Facebook to improve forecast accuracy. Antonio and his team worked with an online clothing brand and compared forecasts that incorporated external social data to those without.
Over a seven-month period they gathered data from over 171,000 Facebook users and produced two sets of sales forecasting models: the baseline forecast, which included only internal company information, and a second forecast that combined internal and social media data.
Using only standard time series modeling like exponential smoothing, averaging, and other methods, the company’s existing sales forecasts for lag 1 had a MAPE of 12%. This was the researchers’ best-performing baseline model. It took into account seasonality as well as internal casual data on the company’s sales and advertising campaigns.
Adding in information from social media brought the error down to 7–9%. The new models used social media comments and natural language processing to categorize each comment as positive, negative, or neutral. Then it combined this information with the internal forecast using a neural network to greatly improve forecast accuracy.
It Can Be Less Complicated Thank You Think
Even without creating complex coding for natural language processing, companies are seeing benefits using more data and existing capabilities. A CPG company that also does direct to consumer sales found a 15%-25% improvement in their item forecasts by looking at the number of new comments and where they were being made. For them, it wasn’t about it being a good or bad comment but rather that any comment was made and the volume of comments for a given item.
Major Improvements In Forecast Accuracy
Using this easy to obtain external data, they developed a simple regression model to incorporate into the forecasting process. With close to 28,000 SKU’s, they saw forecast improvement in over 80% of their SKUs. The overall WMAPE went from 42% to under 35%. Using location tags to mark where the comments came from, they were able to improve location forecasts by 40%, thereby greatly reducing inventory mix between locations.
It’s not just about comments either. Social media users publicly share metadata such as the user’s location, language spoken, biographical data, and/or shared links. Using this information, a retail company used this gold mine to create theoretical consumer profiles and then forecast based on those new clustered profiles. This allowed them to better determine trends within categories and finetune overall item forecasts. With over 100,000 SKU’s they realized a 7% improvement in WMAPE.

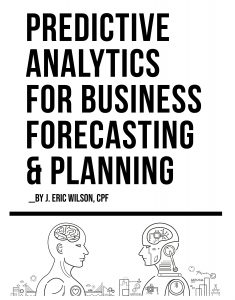
For more information on making the most of the data available to your organization, get a copy of Eric’s book, Predictive Analytics For Business Forecasting & Planning. Giving you the tools to adapt to the data age, this is your guidebook to demand planning 2.0. Get your copy.
