It’s very common in forecasting to aggregate data in order to increase the signal/noise ratio, and there are several papers out there regarding the significant positive effect of hierarchical and temporal aggregation on forecast accuracy. Make no mistake, aggregation is a technique all forecasters should have in their toolbox.
The level of aggregation depends on the data and purpose of the forecast.
Transforming data through aggregation or disaggregation allows you to gather additional information about the series at hand, resulting in better forecasts. Each level for each attribute provides levels of visibility but also provide varying levels of effectiveness or ineffectiveness.
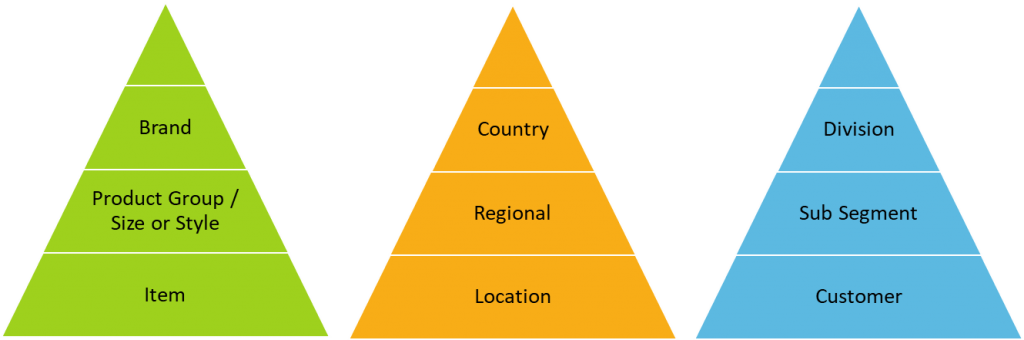
The most common forecasting hierarchies are:
- Item, Location and/or Consumer or end user have the highest error
- Product group, Region, and/or Segment have moderate error
- Brand, country, and/or Division general is less nervous due to aggregating all the variation from lower levels and has the lowest error
Each one is an attribute that may have many levels of aggregation. With today’s data you could easily add more attributes as well with even more levels. Think of price as an independent variable – you could use data at each price increment of a penny, or bucket them by each dollar change or another aggregation of the data at some higher increment. Even time can be aggregated and reconciled, from months to weeks to days and hours.
When To Go High Or Low?
Despite all the potential attributes, levels of aggregation, and combinations of them, historically the debate has been condensed down to only two options, top down and bottom up,
The top-down approach uses an aggregate of the data at the highest level to develop a summary forecast, which is then allocated to individual items on the basis of their historical relativity to the aggregate. This can be any generated forecast as a ratio of their contribution to the sum of the aggregate or on history which is in essence a naïve forecast.
More aggregated data is inherently less noisy than low-level data because noise cancels itself out in the process of aggregation. But while forecasting only at higher levels may be easier and provides less error, it can degrade forecast quality because patterns in low level data may be lost. High level works best when behavior of low-level items is highly correlated and the relationship between them is stable. Low level tends to work best when behavior of the data series is very different from each other (i.e. independent) and the method you use is good at picking up these patterns.
The major challenge is that the required level of aggregation to get meaningful statistical information may not match the precision required by the business. You may also find that the requirements of the business may not need a level of granularity (i.e. Customer for production purposes) but certain customers may behave differently, or input is at the item/customer or lower level. More often than not it is a combination of these and you need multiple levels of aggregation and multiple levels of inputs along with varying degrees of noise and signals.
You’ll Often Need Multiple Levels Of Aggregation
For anyone starting in forecasting, it soon becomes apparent that one size does not fit all. The choice isn’t just between top-down and bottom-up. Middle-out forecasting is another option, starting somewhere in the middle of a hierarchy; for example, from a specific product line or category. Others prefer a hybrid approach, forecasting some items at lower levels and others aggregated. It is clear that often, forecasts can and should be done and multiple levels of aggregation.
With increases in detail of data and systems capabilities that perform dynamic hierarchy and multiple integration forecasting, we have even seen predictive analytics optimizing our aggregation. Much like ensemble methods in machine learning that are composed of multiple weaker models that are independently trained and whose predictions are combined in some way to make the overall prediction, we can do the same thing with reconciliation and hierarchies. Multiple weaker hierarchies can be combined using regression or other approaches to optimize the overall prediction at every level.
Key Points To Remember When Aggregating & Reconciling
So, how should we approach reconciliation and aggregation of forecasts?
There are a few things you should consider and you have a few options. Starting with the consideration think about the following when deciding what level of aggregation to start and end at:
- The level of aggregation of the inputs into the process such as POS data, website clicks, or sales and marketing intelligence, etc.
- The level of aggregation needed as an output and the usage and downstream decisions to be made from outputs
- Hierarchy and reconciliation procedures within software design
- The planning process design or constraints as well as organization structure and resources of planning team
- The aggregation of the optimal statistical algorithms and parameter settings
After you have considered the ins and outs and process in between, you should always attempt to forecast at the highest level of aggregation compatible with the process and decisions goals. This means that the hierarchy should only include levels needed for forecasting. Too often we believe more detail always means better precision when it could be making things measurably worse.
It is part of a demand planners’ responsibility to understand the attributes, the levels, the inputs, outputs, and model limitations. We no longer have only a debate between top and bottom but need to look at things dynamically. Managing this effectively can maximize your resources used while improving the forecast the business uses.
Aggregating data for forecasts is one of topics that will be discussed at IBF’s Boston Academy from August 12-13, the world’s leading training event for S&OP, Forecasting, Planning & Analytics. Among the value-added workshops is “How & When To Use Top down, Bottom Up, and Other Forecasting Approaches” delivered by Joe Eschenbrenner, Director Of Demand and Supply Planning at Puma. Click here for more information.