Peter Drucker’s famous axiom “You can’t improve what you don’t measure” is particularly relevant to business forecasting. As Demand Planners, we want to measure our forecast performance so we can iterate and improve. Here I present an Excel-based Forecast Performance Tracker (free download available below) that you can use for your own error measurement.
There are various methods and metrics to track and assess Forecast performance. A few of the most widely-used metrics are MAPE, WMAPE, MAD, MSE, RMSE, BIAS, Tracking Signal, as well as Michael Gilliland’s FVA (Forecast Value Added). Demand Planning teams monitor and report the forecast performance. When tracking forecast error through such metrics, it is essential to know why the error has occurred so the root cause can be addressed. There will be always be a certain amount of innate volatility and variability in forecasts. And, since the forecast is validated by human interference and judgements, bias is always present to some degree.
Having an understanding of the error enables us to make decisions that will reduce it. Forecast error can be problematic for organizations – not only within supply chain/operations, but at an enterprise level. Though the steps taken based on the understanding of forecast errors are reactive, we can use those steps to reduce future errors.
Forecast error simply defined is the difference between the actual demand (sales) and forecasted demand. Forecast Error = (Forecast – Actual) / Actual. Root Cause Analysis (RCA) can be split into 3 classifications: Over Forecasting, Product Unavailability and Under forecasting. The following table (Table 1) gives an insight into these 3 RCA classifications.
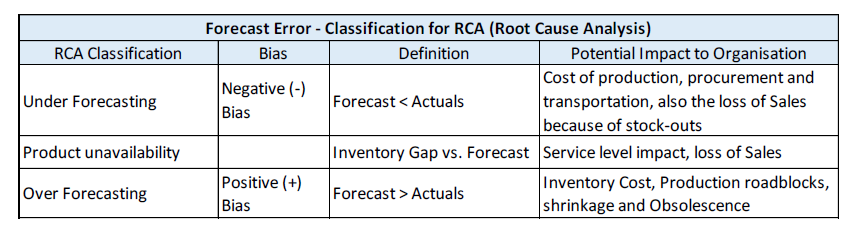
Figure 1 | Root Cause Analysis Classification Model
The RCA Classification model above gives details our 3 classifications of Over, Under and Product Unavailability. The framework also gives details about negative or positive bias. Importantly, it also displays a few of the potential impacts on the business. There is also one more factor we should be aware of that isn’t included in the table – Random Variation. In cases of Random Variation, the error generally corrects itself.
Model To Track Root Cause Analysis Of Forecast Error
Over forecasting and under forecasting are widely discussed in the demand planning literature. However, I haven’t seen much discussion about product unavailability. An Excel-based forecasting KPI tracker is prepared (see a snapshot below).
[CLICK TO DOWNLOAD THE FORECAST TRACKER]
The most important elements are Forecast, Actual Sales, and Inventory (closing) for the given forecasting period (month, week, etc.). For simplicity, we are using 2 products (P1, P2) and 3 locations (L1, L2 and L3). The forecasting horizon is monthly, from January to April. Other details like Sales Representative, Product segment, and Categories can be added as per your business requirements. The purpose is to monitor forecasting performance by product and location on a monthly basis.
You’ll also see the different error metrics: Error, Absolute Error, MAPE/WMAPE, Bias, Over Forecasting, Under Forecasting and Product unavailability.
Screenshot of forecast tracker
Cont.
In this tracker, when you add the monthly forecast, actuals, and inventory data, the rest of the report updates accordingly. All the data analytics are managed in Excel with formulas, pivot tables, and charts.
Forecasting Performance Dashboard
The model contains an interactive dashboard which, at the end of the month, can be used to share forecast error in demand planning/S&OP meetings sessions as a standard report. The dashboard present the data via effective visualizations that depict the narrative behind key performance indicators, including key insights and recommendations on a single screen.
The most important component of the dashboard is the key insights and recommendations. Going into any meetings where the dashboard is used, Demand Planners should have a good understanding of the major forecast errors and be ready to facilitate discussion surrounding actionable steps to remedy the causes. The aim is for senior management to make informed decisions.
Below (figure 2) you can see the dashboard. The key features are the MAPE monthly trend, and top locations and products with highest MAPE for the month. For example, location L1 is experiencing error from under forecasting and therefore needs to be addressed in the meeting to identify what can be done to remedy it. Location L2 is facing under forecasting. To a certain extent this under forecasting is correlated to product unavailability since sales tried to compensate for the forecast target with available and on-demand products.
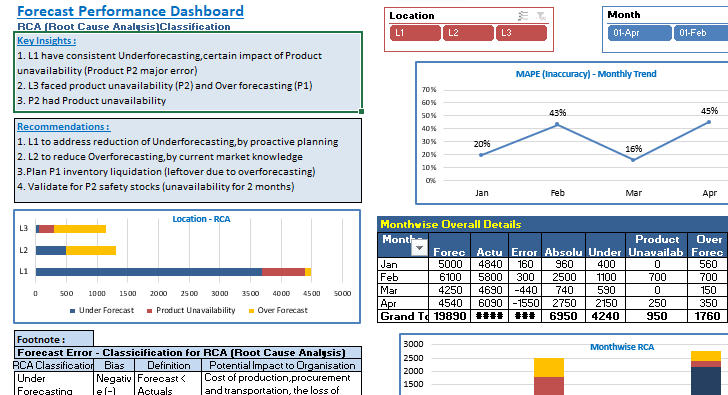
Figure 2 | Snapshot of forecast tracker dashboard
Cont.
Benefits Gained From Forecasting Root Cause Analysis
As Arthur C. Clarke said, “ I don’t pretend we have all the answers. But the questions are certainly worth thinking about.” This methodology enables exactly that – allowing you to measure forecast error and discuss root causes in a simple yet effective way. With insight into root causes, you can optimize your supply responses better and shape demand accordingly. Improved forecast accuracy will naturally follow.
Key Takeaways
1 – Demand Planners should demonstrate strategic value by bringing key insights and recommendations to facilitate informed decision-making.
2 – The purpose of such models is not to highlight ‘WHO’ (any function/role areas) but to effectively address the ‘WHAT’ (cause for over or under forecasting).
3 – Art is an important trait required for Demand Planners. They should convey the key insights, and just the data.
4 – Demand and supply variability is great these days, so be aware that forecast error improvement has a limit as we have no control over external factors impacting demand.
5 – Estimating all the components of error from the demand history is not possible (or even appropriate). Uncertainty is intrinsic.
6 – Demand Planners should persistently develop data analytics skills with a clear approach to storytelling instead of only providing reports based on convoluted mathematical formulas.
7 – Emphasis on forecast accuracy numbers will result in bias. Hence, the focus should be on providing key highlights to the Management team. The most consuming part of the reports is the insights and recommendations sections which enable businesses to take better decisions.
8 – As mentioned in my previous blog, Segmentation Framework For Analyzing Causal Demand Factors, Forecast Accuracy is not the goal but a means toward the larger goals of the enterprise.
Do you find this model useful? Is there any further enhancement that can be done? I am open to hearing from you.
Do you want to understand the logic behind this forecasting performance tracker and dashboard in Excel? Connect me for a session. I will be happy to take you through the tracker and dashboard.
Connect with Manas on LinkedIn and follow him on Medium.
For more demand planning insight, join us at IBF’s Global S&OP & IBP Best Practices Conference in Chicago from June 15-17. You’ll learn the ingredients of effective planning, whether you’re just getting started or are finetuning an existing process. Early Bird Pricing now open – more details here.