One of the questions I get asked most frequently is “What is your favorite forecasting model?” My answer is “it depends” because not all problems need a hammer. Sometimes you need a wrench or a screwdriver which is why I advocate having a forecasting toolbox that we can draw on to tackle whatever forecasting project arises.
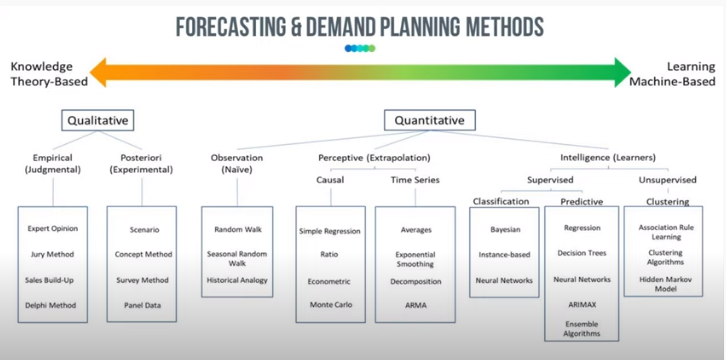
When it comes to forecasting methods, we have everything from pure qualitative methods to pure quantitative methods, and everything in between. On the far left of the image below you’ll see judgmental, opinion-based methods with knowledge as the inputs. On the far right, we have unsupervised machine learning – AI, Artificial Neural Networks etc. where the machine decides on the groupings and optimizes the parameters as they learn the test data. In between these two extremes we have naïve models, causal/relationship models, and time series models.
All of the models should be in our toolbox as forecasters.
But with dozens of methods available to you, how you decide which ones to use? There are cases when sophisticated machine learning will help you and there are cases when pure judgement will help but somewhere in between the extremes is where you’ll find the models you’ll need on a day-to-day basis.

Picking The Right Model For A Particular Forecast
The main thing is to have a toolbox full of different methods that you can draw on depending on the data available and the resources you have. We must balance 3 key elements when choosing a model:
Time available: How much time do you have to generate a forecast? Some models take longer than others.
Interpretability of outputs: Do you need to explain how the model works to stakeholders? Outputs of some models are difficult to explain to non-forecasters.
Data: Some models require more data than others and we don’t always have sufficient data.
For example, putting together a sophisticated machine learning model and training it could take months to build, plus extra time for it to provide a useable output. When a forecast is needed now, this kind of model won’t help. Similarly you have little or no data as with new products, you may have to use judgmental methods.
Balancing interpretability and accuracy is also key. There are models whose accuracy can be finetuned to a great degree but as we become more accurate, interpretability (explaining the rationale behind the number) often becomes more difficult. Artificial Neural Networks, for example, can be very accurate, but if you need to explain to partners in the S&OP process or to company execs how the model works and why they should trust it, well you might have some difficulty.
Time series models like regression or exponential smoothing are much easier for stakeholders to understand. So what kind of accuracy do you need? Do you need 99% accuracy for a particular forecast, or is some margin of error acceptable? Remember that there are diminishing returns to finetuning a model for accuracy – more effort doesn’t necessarily provide more business value.
This is why the best model depends on the context you’re working in.
Judgmental Methods
These are not sophisticated but they have their place. When I have no historic data, i.e. for a new product or customer, I have nothing to forecast with. Remember, human judgement based on qualitative factors is a forecast and it’s better than no forecast at all.
Judgments are also important in overriding statistical forecasts when an external variable emerges that is isn’t accounted for. A model doesn’t know if you’ve just opened a new store or if supply constraints just unexpectedly emerged. Of course, human judgement has bias – be sure to identify it if you’re using judgmental models. In the Judgmental category we have:
Salesforce Method: This involves asking what salespeople think about future demand based on their knowledge of the market and customers.
Jury Method: This simply involves surveying stakeholder’s opinions and letting the consensus decide what future demand is likely to be.
Dephi Method: A more systematic version of the Jury Method where stakeholders blindly submit their estimates/forecasts. You then take a mean of the responses, which is a more robust/accurate method than you might think.
Time Series Models
58% of planning organizations use time series methods. It’s popular because we all have the data we need for this method – we can use sales data or shipment data. Also our colleagues in Finance, Inventory Management and Production can all use these forecasts. Here we identify patterns (whether level, trend, seasonality) and extrapolate going forward.
The key assumption here is that what happened in the past is likely to continue into the future. This means this method works best in stable environments with prolonged demand trends. It doesn’t perform so well with volatile products/customers, new products and doesn’t explain noise.
Averaging Models
Instead of using one single data point like a naïve forecast, here we’re using more data points and smooth them, the theory being that this provides a more accurate value. In this category we have simple moving averages and exponential moving averages. The difference between the two is that SMA simply calculates an average of price data while EMA applies more weight to more recent data points.
Decomposition Models
These models take out the elements of level, trend, seasonality, and noise components, and add them back in for a forward-looking projection. It’s a good statistical method to understand seasonality and trend of a product.
Exponential Smoothing
These are the most used methods and include single and double exponential smoothing, with the Holt model and Winters model being widely used. There is also Holt-Winters which is a combination of the two which is a level, trend, and seasonal model so we’re getting 3 attributes of the time series, enabling an exponential curve weighting the past exponentially.
If a naïve model is taking a single point and averaging them to make multiple points, we’re now taking multiple points and weighting them differently, considering level, trend and seasonality. I find this to be a very versatile model that is appropriate for a lot of data sets. It’s easy to put together, can be used with relatively little data, and is easy to interpret and explain.
Going Beyond Time Series Models
All data is not time related or sequential. And all information is not necessarily contained within a dataset. Casual or relationship methods assume that there is an external variable (causal factors) that explains demand in a dataset. Examples of causal factors include economic data like housing starts, GDP, weather etc. Relationship models include penetration and velocity models where you add variables to a model.
These carry on nicely from exponential smoothing models that identify level, trend, seasonality and noise. The noise can be explained with causal models and can identify whether there is an external variable (or several). This is useful when there is a lot of noise in your data. Generally speaking, these models are useful alongside series models to explain the consumer behavior changes that are causing the changing demand patterns/noise.
Machine Learning Models
Machine learning models take information from a previous iteration or training data set and use them to build a forecast. They can handle multiple types of data which makes them very useful. There are interpretability issues with these models, however, and there is a learning curve when it comes to using them. But it’s not too difficult to get started with the basics – Naïve Bayes is a good place to start.
Clustering Models
Clustering, a form of segmentation, allows us to put data into smaller more manageable sub-groups of like data. These subgroups can then be modeled more accurately. At a simple level, classification can be the Pareto rule, or they can be more complex like hierarchical clustering using a dendrogram (a form of distribution which considers distribution of points) and K-means where we group data based on their distance from a central point. They’re all ways of breaking up large data sets into more manageable groups.
Picking the Best Model
Understand why you’re forecasting. Think about how much time you have, the data you have, your error tolerance and the need the need for interpretability then balance these elements. Start simple (naïve might get you there) and work from there. You might need a hammer, screwdriver, or wrench – be open to using all the tools in your toolbox.
 To add the above-mentioned models to your bag of tricks, get your hands on Eric Wilson’s new book Predictive Analytics For Business Forecasting. It is a must-have for the demand planner, forecaster or data scientist looking to employ advanced analytics for improved forecast accuracy and business insight. Get your copy.

