At Nespresso, we started the Collaborative Demand Planning (CDP) initiative two years ago, with the aim of forecasting Nespresso sales in a data-driven way. The goal of CDP is to reduce demand planning bias, minimize working capital and set up automated statistical forecasting. Switzerland, Brazil and France have been selected as pilot markets. These countries are very useful to study ways of working for the three Nespresso categories: Coffee, Machines and Accessories.
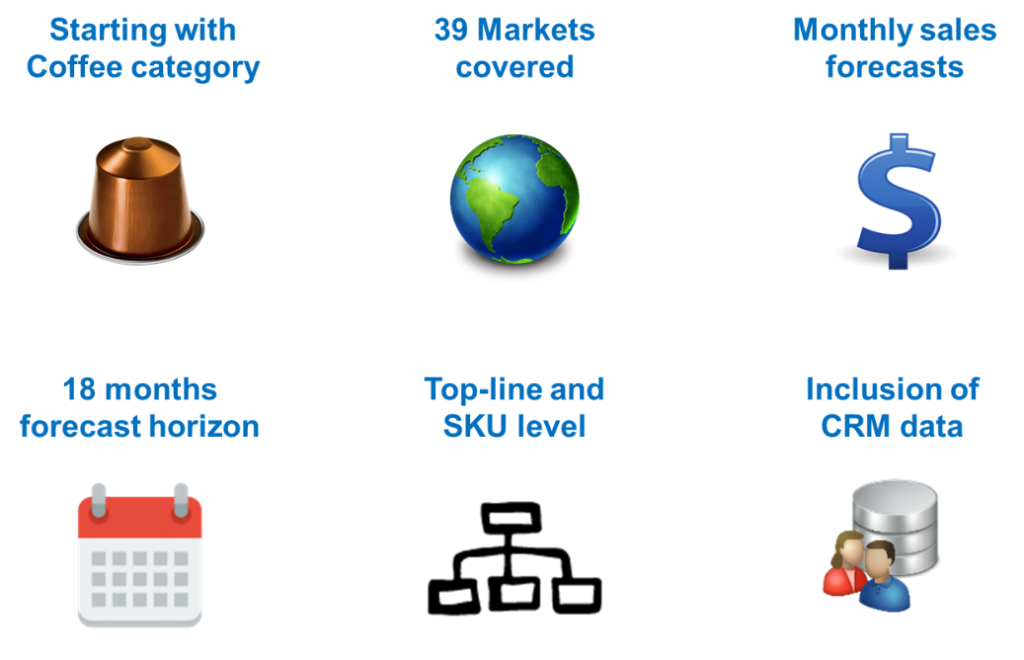
Coffee, the most important and mature category, has been selected for a full roll-out of statistical forecasting. As of February, the HQ Demand Planning team provides sales forecasts to 39 Nespresso markets. Nespresso HQ is acting as a hub, generating, analyzing and sharing forecasts for those Markets. The CDP initiative is summarized in the following image.

Scope of the Collaborative Demand Planning initiative
We use a SAS solution to generate both topline and SKU-level forecasts for each market. While we define specific ARIMA models at topline level, we let the tool automate forecasts at SKU level. In addition to sales history, we include causal variables such as key promotions, customer data, number of boutiques and B2B sales force information. This allows us to take into account domain knowledge from each market.
Questions We Asked When Establishing The Process
In the last two years, we learnt a lot about key questions related to business forecasting. Here are the important topics we had to review while implementing the project:
- What do we want to forecast (warehouse output vs. final sales to the consumer)?
- What is the forecast horizon?
- Should we forecast weekly or monthly?
- Which reconciliation strategy should we use (top-down vs. bottom-up)?
- What family of models is better in our case (ESM, ARIMA etc.)?
- Which causal variables should we track and include in our forecasting models?
How We Use Customer Data
Since Nespresso is mainly selling directly to the final consumer, we can use customer data to improve forecast accuracy. Examples of customer data includes member base and average consumption. To avoid multicollinearity issues, we perform a careful selection of variables based on a correlation analysis with sales. To evaluate the success of this initiative, we are tracking metrics such as sales forecast accuracy, adoption and DPA. Research activities on forecasting Machines and Accessories are performed in parallel.
Having completed the implementation and roll-out, we are now working with teams in individual markets to build trust and increase forecast adoption. This is where the expertise of the HQ Demand Planners is coming into play. Each month, the team is reviewing, analyzing and sharing forecasts with the markets. At this point, we see the limitations of what the tool can do. The forecasting tool is perfect to find models that minimize forecast error but several proposed models have been found to be unusable and unrealistic.
Filtering Out Unusable Forecast Models
An example of an unusable model is one proposing a flat forecast (i.e. each month the same value). Even though it may minimize the error, it won’t be trusted by stakeholders. We consider models as unrealistic when the proposed growth is unlikely to happen in reality. We found that reviewing both the shape of the forecast and the YTD vs. YTG are crucial to propose forecasts that are trusted and adopted by our stakeholders.

