During my 30-plus years in Supply Chain Management I have participated in many projects as a practitioner, consultant or educator to improve demand forecasting. I have also participated in many projects to improve inventory management. My experience is that most businesses have not done enough to link these two areas from a people-process-technology perspective. This article highlights some lessons I have learned and provides some suggestions to improve the link between these important processes.
New Products & Inventory Control
We all know the story regarding new products. Sales and Marketing are conditioned to over-forecast these in most cases. In their view it is much better to create excess inventory than to risk a loss of revenue. Of course, in most units Sales & Marketing are not held responsible for inventory levels or dysfunctional inventories. Supply Chain is accountable for inventory performance, but this responsibility does not usually address new product introductions in a timely manner. Often excess and aged inventories result from lower than expected demands for new products. Several years ago, a business unit with poor inventory performance got a new leader. When discussing this with the Supply Chain leader, he was told that new product and trial inventory was over $500,000. He directed the Supply Chain manager to add this inventory performance to the monthly report reviewed in the S&OP meeting. Table 1 depicts an example of the report, along with comments.
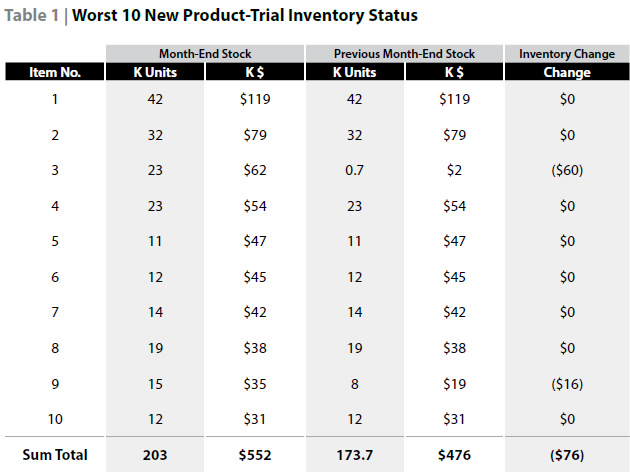
- There were no sales for these 10 items in the month.
- Inventory increased on two items which were produced to the original plan although no sales have occurred the past three months.
- The current month-end value of this inventory ($552,000) represents approximately 85% of total new product-trial inventory.
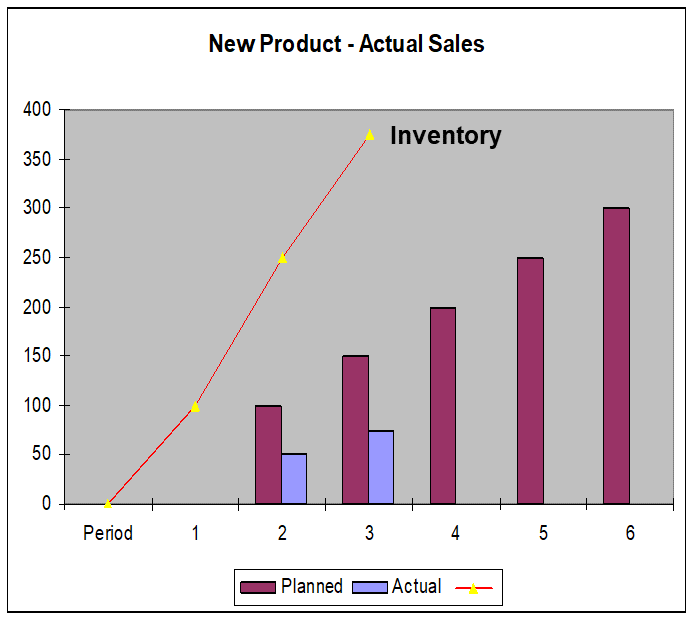
Based on this poor performance, the business implemented a process whereby the sales forecast was used to establish an inventory plan. The actual sales and inventory were compared to plan and a meeting was held every two weeks between the product development, marketing, sales and Supply Chain functions. The result was improved demand-supply balancing in both quantity and timing. Chart 1 explains further sales, production and inventory, and Chart 2, planned and actual inventory.
Chart 1 | New Product Sales & Inventory Plan

Chart 2 | Tracking New Product Sales and Inventory to Plan
Demand versus Stocking Strategy
The textbooks tell us that make-to-stock strategy should be limited to higher volume products that are easy to forecast. This ensures an acceptable inventory investment and that slow-moving and obsolete inventory can be controlled. One mechanism to evaluate the stocking strategy is ABC-XYZ volume variance analysis. Variance is based on the Coefficient of Variation (CV) which is defined as the standard deviation in period sales divided by the average period sales. Most practitioners use a CV threshold of >1.0 to segment those products which will be difficult to forecast. If the product also has low sales volume (C item based on volume), the correct stocking policy is make-to-order (see Table 2).
Table 2 | Sample ABC-XYZ Analysis with CZ Item
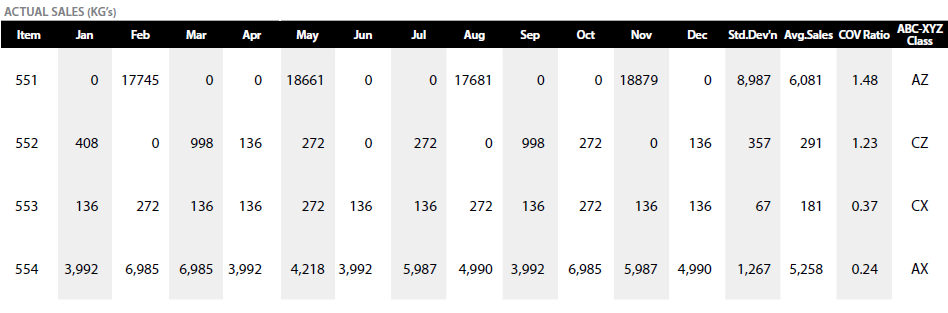
Notice Article 551 in Table 2 has both high volume and high variance in demand. Collaboration with the customer resulted in a stocking policy to ensure product availability at the point of order. Here the customer provided an order schedule. In this case Article 552 was being forecasted using a 3-month moving average. The result was being out of stock in some months and having excess inventory in others. Chart 3 depicts the actual demand for this article.
Chart 3 | Actual Sales for Article 552 (CZ Article)
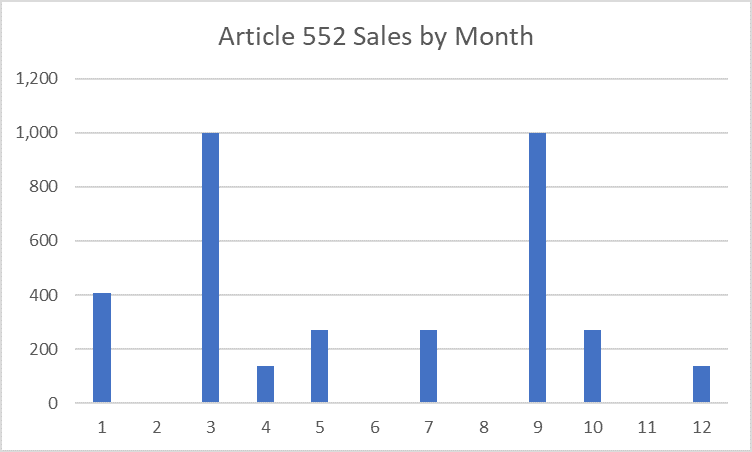
As indicated by the quantitative analysis, this article should not be made-to-stock based on a forecast. Some firms use re-order point planning based on average demand for articles with erratic sales patterns. As such, it would not yield acceptable inventory and service.
After collaboration between Supply Chain, Sales and Marketing, it was decided to place the article on make-to-order status. In addition to the erratic demand pattern this article requires a unique raw material in production and the risk of producing this article to stock is high.
Best practice is to perform the volume-variance analysis periodically. The frequency (monthly, quarterly, twice per year) depends on how dynamic demand is within the business. The Demand Planner should perform the data analysis and the Supply Chain leader should facilitate a review with Sales & Marketing in which decisions must be made. There is a strong link between forecastability and inventory control.
Forecast Error & Safety Stock Inventory
Another key link in planning is the use of the demand variance or forecast error to plan safety stock levels. The use of subjective safety stocks by ordering early is common in industry. This judgment model for determining safety stock quantity leads to high inventory. Below is an example of using forecast error to set safety stock levels.
Chart 4 | Use of Statistical Safety Stock Based on Forecast Error
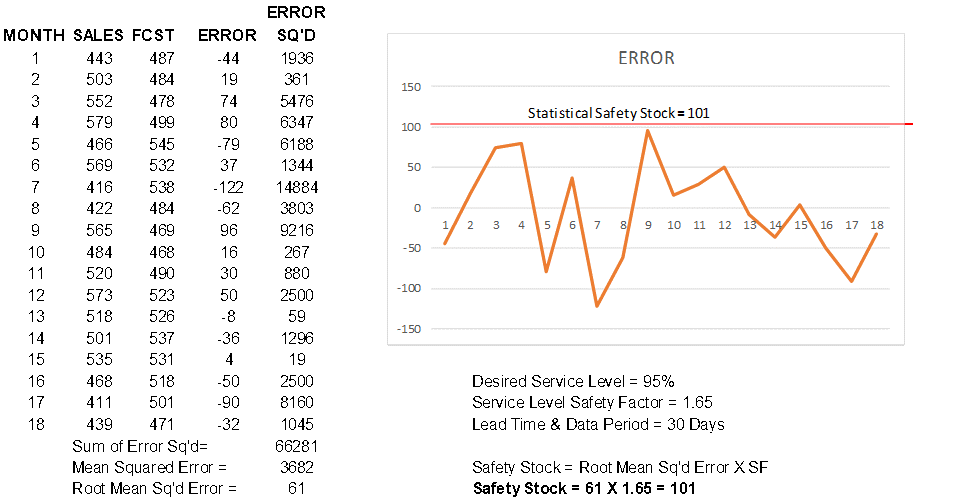
As shown in Chart 4, the resulting statistical safety stock performs well based on historical sales. Statistical safety stocks assume the sales data is normally distributed (bell curve). In this example, the average sales are 498 units and the standard deviation of sales is 57. This yields a Coefficient of Variance of 0.12 (57/498). As mentioned before, CoV’s of less than 1.0 indicate that variation approximates normal distribution and use of statistics based on normal distribution is a valid approach. Next we will look at an example of erratic demand versus safety stock level.
Erratic Demand & Safety Stock Inventory
For some businesses, many items have demand patterns that are difficult, if not impossible, to forecast. Chart 5 gives such an example.
Chart 5 | Erratic Demand & Safety Stock
The CoV test indicates bell curve statistical techniques are not valid in this case. CoV is greater than 1.0. If statistical safety stock is used, both over-stocks and stock-outs will occur. In that case, the best solution is to place it on a make-to-order policy. However, if the customer insists on the supplier keeping some stock, the best solution would be to maintain a minimum safety stock of 1,500 units. This covers demand for ten of the twelve months. For the two months when demand far exceeds average, the options are advance warning from the customer, expediting by the supplier or longer delivery lead time.
A key point is that the actual demand pattern can help in developing a stocking policy. So often I have been told by planners they just use re-order point based on average demand for those items with erratic sales. Of course, re-order point was created to handle items with stable demand and random variation and does not work well for patterns like this one.
The use of forecast error or demand variance in safety stock calculations often gets a bad reputation because the tool is applied to items with erratic, non-normal demand patterns. Use of the CoV data and inspection of the demand pattern can help to ensure statistics is used but not abused.
Using Exception Reports to Link Demand Planning & Inventory
A good practice is to link forecast performance to inventory and service. The “Top Ten” report below is reviewed in the S&OP Meeting each month.
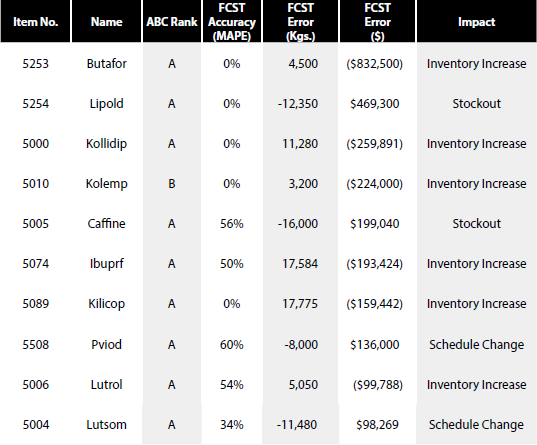
The red numbers represent how much inventory was planned due to over-forecasting these products. The inventory totals over $1.8M for this month. The other items were under-forecasted resulting in schedule changes or stock-outs. In this case, the stock-outs did result in customer backorders. This business offers dozens of finished goods line items and exception reports are used to prioritize improvement efforts.
Summary
The Supply Chain function is usually accountable for inventory management. They should ensure this includes new product inventory management and work with Marketing & Sales to get inventory plans in place. One aspect of product portfolio management is the evaluation of demand volume and variance. Supply Chain should ensure this analysis is performed periodically and that Marketing and Sales participate in review of the data. Decisions regarding whether to stock the product and how to ensure availability if stocked need to be a team effort.
For items with reasonably normal demand patterns, Supply Chain should link safety stock quantities to demand variance or forecast error. Excess and slow-moving inventories should be monitored routinely; this can help to identify when stocking policies and safety stocks need a review. If items with erratic demand patterns must be made-to-stock, Supply Chain must work with Marketing and Sales to decide what stocking policy is required. It is best not to provide an invalid statistical forecast but rather identify items which require decisions based on informed judgment. The use of exception reports such as “top ten” forecast errors, or “worst ten” over stocks each month is a better practice. Also, the use of the ABC principle to ensure resources are focused on those items that significantly impact the bottom line is very important. The “C” items provide more challenges for both demand planning and inventory control but usually represent a small percentage of revenue.
In closing, Supply Chain must take the lead to integrate new product planning and product portfolio review in the S&OP process. Seldom are marketing and sales held accountable for the inventory and cost issues for mistakes in these processes. Demand planning and Supply Chain are accountable for linking actual demand patterns to safety stock decisions. They must also routinely perform inventory analyses (e.g., slow moving, excess, obsolete) to identify priorities and the need for change. Supply Chain serves as the link between Marketing, Sales, Finance and Operations to better balance service-cost-inventory.
This article originally appeared in the Spring 2020 issue of the Journal of Business Forecasting. Click here to become an IBF member and get the journal delivered to your door quarterly, as well discounted access to IBF training events and conferences, members only workshops and tutorials, access to the entire IBF knowledge library, and more.