Unidentified and untreated outliers can generate false expectations for business, causing future disruptions, excess stock and loss of market opportunities. Appropriate action is critical for the accuracy of future forecasts.
An important factor in dealing with outliers is that the statistical models used in sales forecasting use history to project the future, so an unrecognized and untreated data point will generate unreliable predictions for decision making. Faced with this, we need to understand why these outliers occurred and adjust the data accordingly. This process of identifying and dealing with outliers needs to be monthly and in the most serious way possible. The involvement of the commercial team is essential in this process. But first let’s look at what outliers are.
What Are Outliers?
Outliers are unusual behaviors, usually called “points outside the curve”. In statistics, an outlier is an aberrant value or atypical value, an observation that presents a great deviation from the standard or that is inconsistent. The existence of outliers typically implies losses in the interpretation of results which can lead to false conclusions about the data, which in our case would be an inaccurate sales forecast.
These points outside the curve can deviate upwards (from the upper limit) or downwards (from the lower limit).
Here is an example:
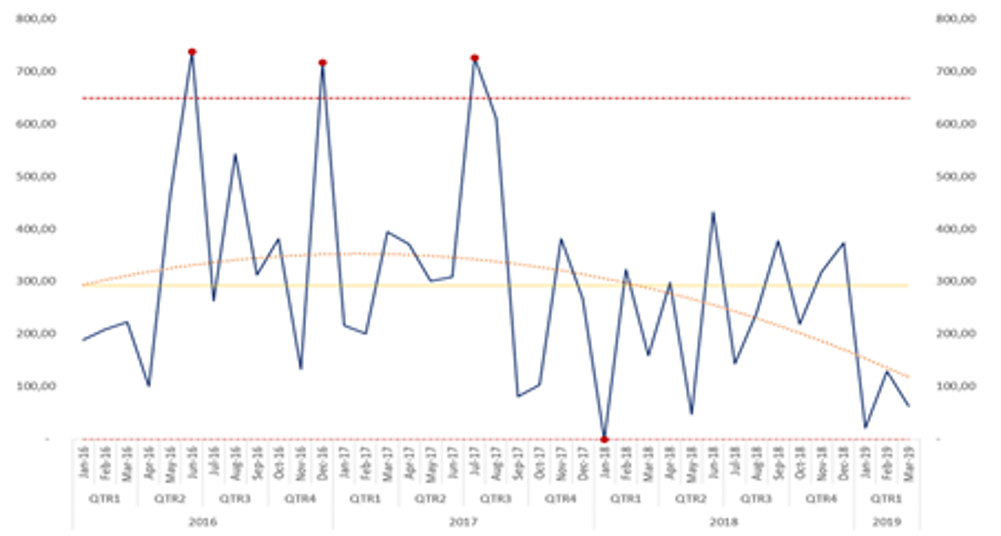
Outliers are deviations from the statistical norm.
How Are Outliers Generated?
In demand planning, outliers are non-standard behaviors, they come from some specific actions. The most common are:
New Customers: Outliers can happen when the commercial team is able to land new customers, particularly large ones like chains or wholesalers.
Forced Sale: The most common cause of outliers is due to shelf life whereby the company decides to sell its products at a lower market price, preferring to sell at cost than pay the costs relating to disposal of the stock and thus making a loss.
Stockouts: Sometimes, for different reasons, there are disruptions in supply meaning we cannot get the product to the customer. This causes a downward outlier. Disruptions typically occur because of increase in sales, breakdown of production equipment, delay in imports, lack of raw materials, etc.
Advance Sale: There may be anticipation of customer orders when an increase in price, a shortage of some product, or even a potential natural disaster (snowstorms, hurricanes etc.) are signaled. In cases like these, customers or end consumers may stockpile your products.
Other Events: Other events may occur, such as new competitors entering the market, speculation, promotions, customer birthdays etc.
The important thing is to identify the outliers and their cause so they can then be treated.
How To Identify Outliers
There are different ways to identify outliers, the simplest ones are:
1. Graph Analysis
Analyze the data in graphs as shown in the figure above. To facilitate the identification of outliers graphically, it helps to plot the data on a dashboard so the data can be seen in different hierarchies and granularity e.g. region, product family, managers, channels, and SKU. Doing this is useful because, many times, when we look at the total number, we may not be able to identify the outlier. This is because if it has low volume, it will be lost in the rest of the data. But when we go down a level in the hierarchy, we can begin to identify them.
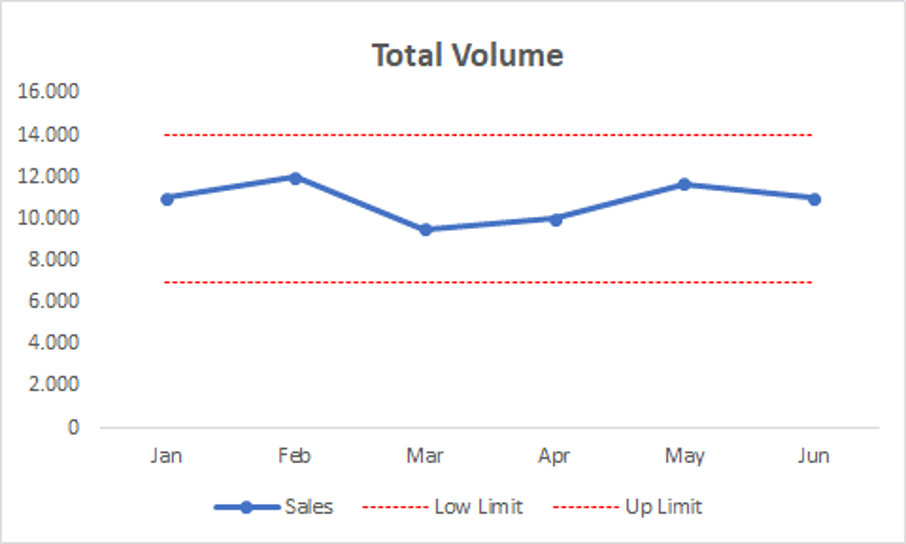
Sales within the normal range.
Selected family chart – Outlier Identified In May
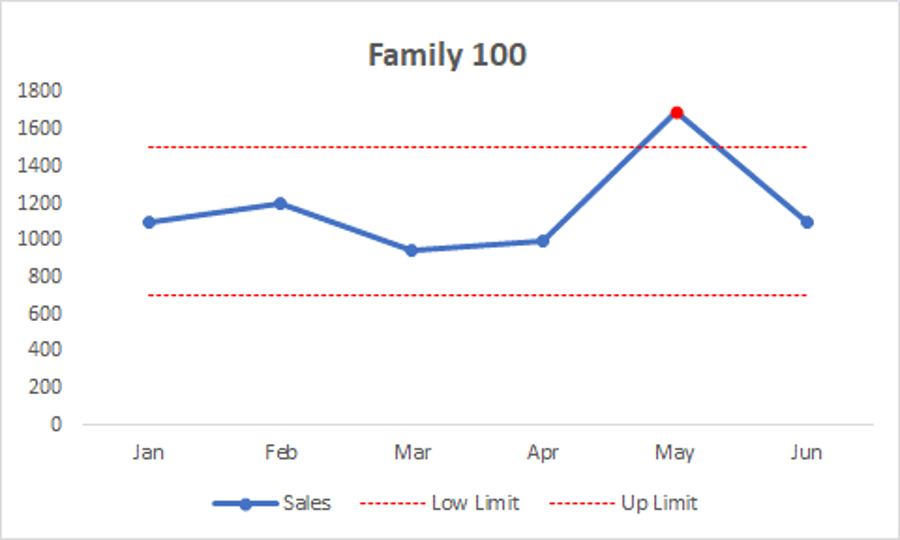
Sales breaking the upper limit.
2. Table Analysis
Another way to identify outliers is through tables, using a percentage as a comparison. This analysis needs to be done monthly. In the following example, we have normal behavior for item 1 from January to May. In June, however, when we updated the standard deviation, we identified a data point 62.5% above normal, which is definitely an anomaly and needs to be understood and addressed.
Item 3, on the other hand, signaled a drop of 11.4%. Such a drop is just a warning to keep an eye on it, as it is too low a deviation to invest time in investigating further.
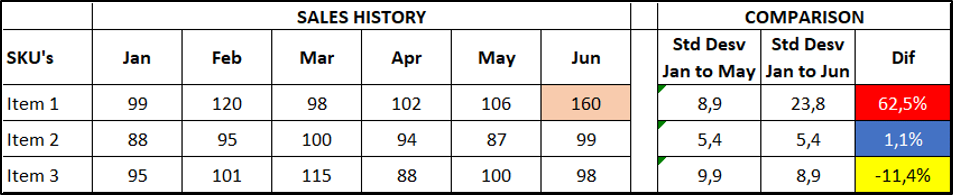
Each business and each SKU will have its own percentage limit guardrail. This variation limit may vary depending on the item’s added value, ABC classification, margin, strategy, etc.
3. Statistical Analysis
The most complex (and most reliable) way to identify an outlier is through statistical methods. The most common methods are Interquartile Range and Regular Z-Score.
How To Treat Outliers
After identifying the outliers, it is necessary to understand why it happened, which means talking to Sales. The reasons must be registered so that in the future, if it occurs again, it can be treated in the best way.
The way we treat outliers varies according to the reason:
Base Exclusion: Only volumes resulting from typing errors/order input should be excluded from the base, or cases that will never be repeated. Otherwise, it must be treated within the base.
New Customers: As previously mentioned, a new customer needs a minimum order amount. Depending on the Sales’ expectation, the customer can order for up to 3 months. After confirming with Sales that the customer has purchased for 3 months, we treat the outlier by diluting the total incoming volume by 3.
Forced Sale: Considering that the sale was forced (sold at cost to avoid a loss) due to shelf life and the customer took advantage of the low acquisition cost opportunity to make a promotion, this additional volume purchased by the customer should be excluded from the base, as it would only happen again if the same process is repeated, which is unlikely.
Stockouts: In cases of stockouts where there was an order for a product but no inventory to provide it, actual sales differ to demand. Therefore we want to include the order volume in our future forecasts to maintain accuracy as this is what represents true demand.
Advance Sale: In cases where it was identified that sales were anticipated, the treatment of outliers is similar to new customers, the only difference being the horizon in which the volume is diluted forward, for example 3 months, 6 months, etc.
Other approaches: There are cases where customers deviate from buying their usual amount to lower their inventories, for example, then the following month they buy additional volume. In this case, the volume should be diluted backwards, in the months when the customer didn’t buy their normal volume.