We can no longer ignore data. Now that we have begun to define it and find new ways of collecting it, we see it everywhere and in everything humans do. Our current output of data is roughly 2.5 quintillion bytes a day and as the world becomes ever more connected with an ever-increasing number of electronic devices, it will grow to numbers we haven’t even conceived of yet.
We refer to this gigantic mass of data as Big Data. First identified by Doug Laney, then an analyst at Meta Group Inc., in a report published in 2001, Big data has commonly been defined as “information that is high-volume, high-velocity, and/or high-variety beyond normal processing and storage that enables enhanced insights, decision making, and automation”.
The problem is that “high volume” and “normal” are relative to your company size and capabilities. For this reason, I prefer to look at Big Data as a continual growth in data Volume, Velocity, and Variety beyond your company’s ability to store or process or use it.
The Problem With Big Data
The challenge with the sheer amount of data available is assessing it for relevance. The faster the data is generated, the faster you need to collect and process it. Not only that, data can be structured in many different ways and comes from a wide variety of different sources that need to be tied to together and sorted out. And finally, when we talk about Big Data, we think of it as raw information and not about the strategies to deal with it or the tools to manage it.
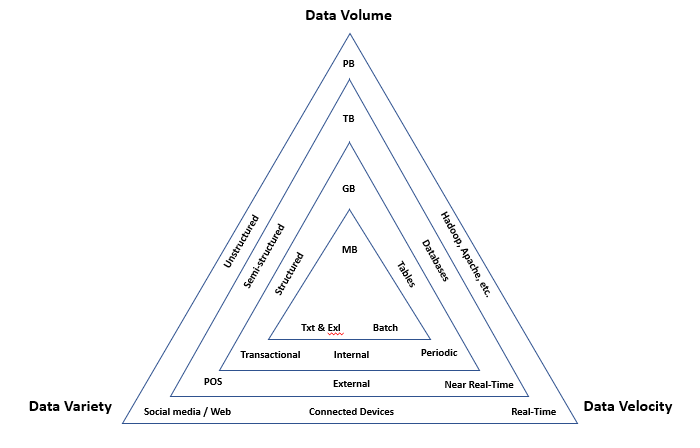
[Credit: Doug Laney]
Volume
Big data is about volume and refers to the large amount of data involved. The size of available data is growing at an increasing rate. If there was ever “small-data”, it was generated internally from enterprise transactional systems and stored on local servers. Today, businesses are constantly collecting data from many different outlets like social media, website lead captures, emails, eCommerce and more. This has begun to outgrow an organization’s capabilities to manage these larger volumes of data – a major issue for those looking to put that new data to use instead of letting it go. If this sounds familiar, you are dealing with Big Data, and it’s probably a big headache.
More data sources that create more data combine to increase the volume of data that has to be analyzed. The world holds an enormous amount of data, possibly an incomprehensible amount. With over 90% of today’s data being generated in the past 2 years, that comes to about 2.5 quintillion data bytes daily. Perhaps 10 or 15 years ago, terabytes qualified as high-volume data, but these days you’re not really in the Big Data world unless you’re dealing with exabytes (1 million TB) or petabytes (1,000 TB).
To deal with these larger volumes of data, companies are moving from desegregated data sources to data lakes and warehouses, and data management systems. Storage is transforming from local servers to the cloud and external partners like Amazon and others. For processing, we are considering tools like Hadoop and Apache. Business intelligence software for data cleansing and data visualization are becoming more prevalent. And in predictive analytics, we are considering new methods and approaches to analyze larger sets of data and capture greater insights.
Velocity
Velocity measures how fast the data is coming in. Big Data isn’t just big; it’s growing fast. It’s also coming in at lightning speed and needs to be processed just as quickly. In the olden days (3 to 5 years ago), companies would usually analyze data using a batch process. That approach works when the incoming data rate is slower than the batch processing rate and when the result is useful (considering there’s a delay). But with the new sources of data and the need to be more agile in decision making, the batch process breaks down. The data is now streaming into the server in real time, in a continuous fashion and the result is only useful if the delay is very short.
Think about how many website clicks, consumer transactions and interactions, or credit card swipes are being completed every minute of every day. Consider the sheer number of SMS messages, the 300,000 social media status updates, the 140,000 photos uploaded, and the 500,000 comments made every minute. Add to this the Internet of Things and the constant real time transmissions and you’ll have a good appreciation of the speed at which data is being created.
We need real time tools (or close to real time) to collect, analyze, and manage all this data, then act on it. Demand sensing is the key to this. Demand sensing is sensing demand signals, then predicting demand, and producing an actionable response with little to no latency.
According to the Summer 2012 issue of The Journal of Business Forecasting, demand sensing sorts out the flood of data in a structured way to recognize complex patterns and to separate actionable demand signals from a sea of “noise.”
Besides this, velocity also calls for building Big Data solutions that incorporate data caching, periodic extractions and better data orchestration, and deploying the right architecture and infrastructure.
Variety
Data is big, data is fast, but data also can be extremely diverse. Data variety refers to all the different types of data available. Data was once collected from one place (more than likely internal) and delivered in one format. It would typically be in the form of database files such as Excel, CSV and Access. Now there is an explosion of external data in multiple forms and unstructured data that doesn’t fit neatly on a spreadsheet. This, more than any of the other vectors, can quickly outpace an organization’s ability to manage and process their data.
Variety is one the most interesting developments in data as more and more information is digitized. A few decades ago, data would’ve been in a structured database in a simple text file. Nowadays we no longer have control over the input data format. Consider the customer comments, SMS messages, or anything on social media that helps us to better understand consumer sentiment. How do we bring together all the transactional data, POS data from trading partners and sensor data we collect in real time? Where do you put it?
Although this data is extremely useful to us, it can create more work and requires more analytics to decipher it so it can provide insights. To help manage the variety of data there are also a variety of techniques for resolving problems. We no longer just extract and load, we are now importing data into universally accepted and usable formats such as Extensible Markup Language (XML). To sort through the volume and variety of data we are using data profiling techniques to find interrelationships and abnormalities between data sources and data sets.
The Bottom Line
Big data is much more than just a buzzword or simply lots of data. It is way to describe new types of data and new potential for greater insights. The three V’s do well to describe the data, but we still need to remember that even Big Data is still the small building blocks. For Big Data to be valuable, we need more data coming in faster from multiple sources – and we need the systems, analytics, techniques, and people to manage that process and derive value from it.
[Editor’s note: The 3 Vs in Big Data concept is taken from “3D Data Management: Controlling Data Volume, Velocity, and Variety”, Gartner, file No.949. 6]