When it comes to visualizing data in the S&OP process, most stakeholders like to see forecasting outputs in the form that they are most familiar with – Excel. This is certainly true in my experience working in global FMCG companies.
Below I present an Excel tool which I have used many times as a Demand Planner. What you see below has been employed at the Demand Review meetings to great effect at large corporations with very mature demand planning and S&OP processes. It is an ideal solution both for smaller companies just starting their S&OP process that do not want to make a big investment in technology, as well as bigger companies where stakeholders want an easy to understand and recognizable format of data presentation.
Click Here To Download The Forecasting Demand Review Tool
It opens in the web version of Excel. I recommend to download to your computer and open in the Excel application. You can input your own data into this tool from an advanced system (e.g. statistical forecast from APO).
Purpose Of The Tool
The purpose of the tool is too support discussion at the Demand Review meeting with data in format familiar to all stakeholders, and with analytical functionalities that will help to finish the meeting with best possible consensus forecast, including incorporating information from Sales.
As the meeting involves many departments including Demand Planning, Sales , Marketing and Finance, the goal is not to review forecasts SKU by SKU, but on an aggregated level. The level of aggregation depends on the product complexity, i.e. the number of categories/brands/SKU’s. Discussion should be had for groups of products with similar sales characteristics, e.g. groups of products that are sold in similar percent splits. Further volume split per SKU can be determined by more or less advanced statistical methods.
View & Functionalities
The tool operates on historical sales data and forecast figures. Data are presented on different level of aggregation. For product dimension, the tool presents historical sales data and forecast at three aggregation levels: product group/segment/category. For the customer dimension, there are also 3 aggregation levels at which the user can review historical sales: customer/channel/market.
Selection and historical data:
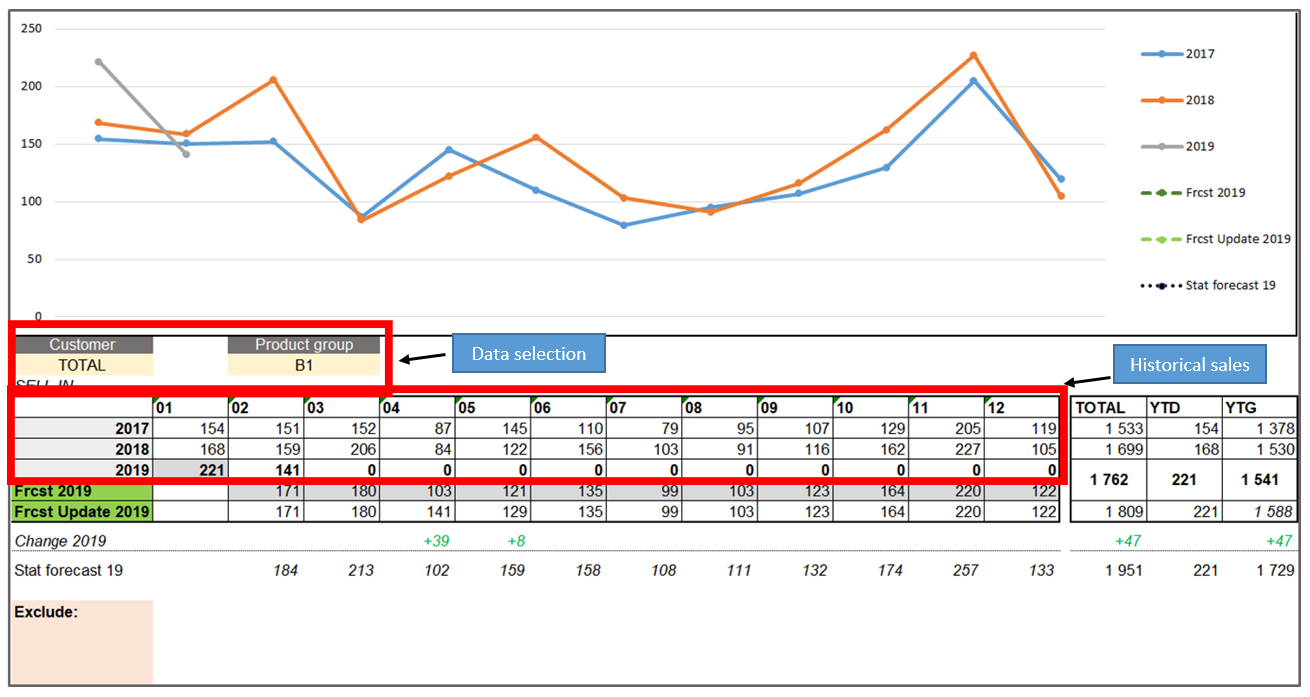
The above screenshot shows customer and product data. The user can select historical sales data and forecast of Product Group A. It is possible to drill down to sales of Product Group A for particular a customer or sales channel. The tool shows the current and previous two years of sales. The reason I choose 2 previous years of sales is that when looking at the chart it is quite easy to understand the seasonality of the product.
Forecast data: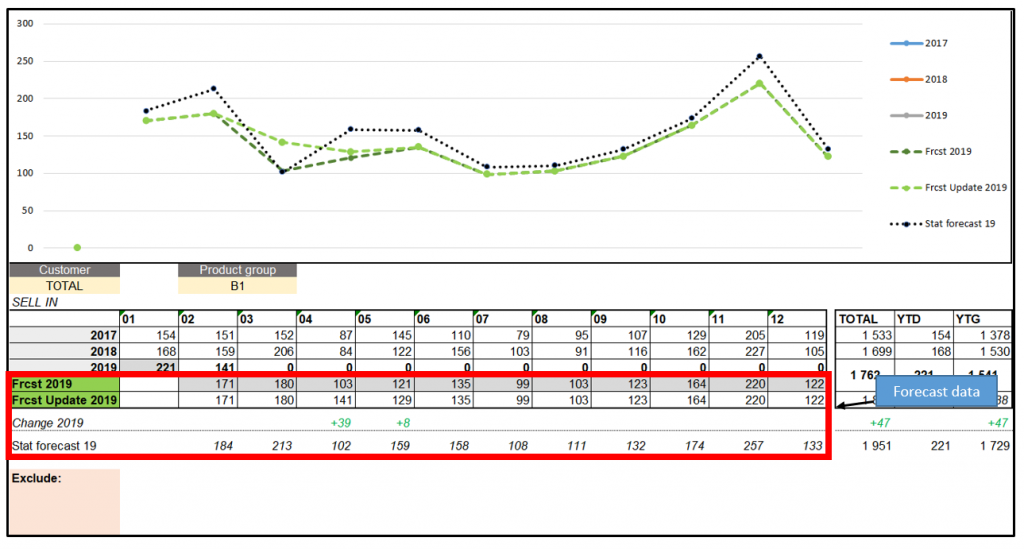 On the above screenshot you can see forecast data from the last cycle, labelled “Frcst 2019”, then below, you can see the new figures which were updated in the meeting. The user simply types new figures in this line at the lowest level of Product dimension (Product Group) and saves them. The next line “Change 2019” shows the differences between the updated and last cycle figures. The line “Stat forecast 19” is a Seasonal+Linear regression model that is built in Excel and calculates a statistical forecast based on historical sales in the current selection.
The user has the possibility to select what kind of data lines he/she would like to see on the chart through check boxes.
Exclude customers functionality:
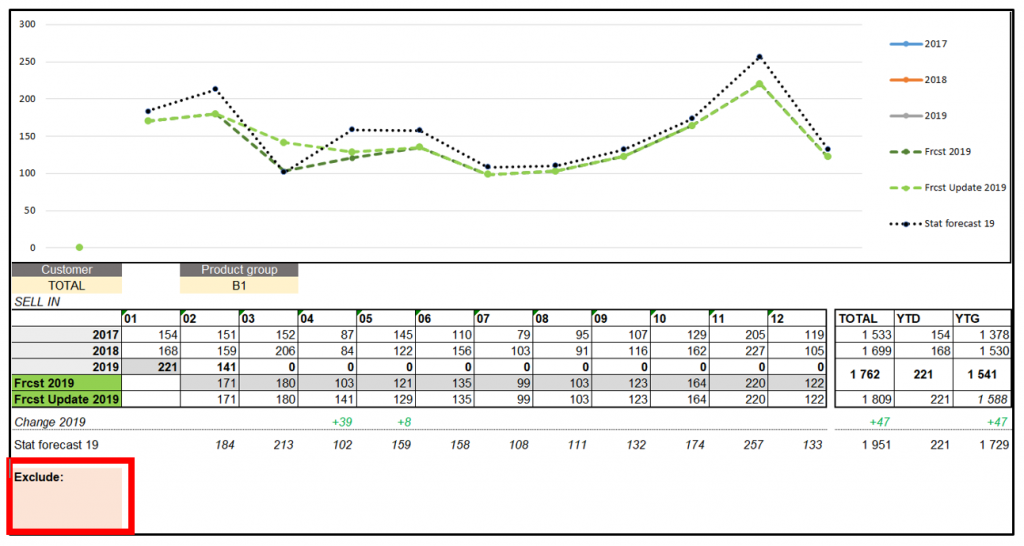
The functionality in the red box in the above screenshot allows users to exclude particular customers simply by pasting their name into the pink area. It is useful when we want to look at overall market sales without customers that cause outlying sales. These volatile customers can skew our view of the whole market.
How To Use The Demand Review Tool
Usually, a more detailed customer forecast revision is done for the period which is going to be frozen in current S&OP/IBP cycle. Demand review and analysis of the forecast for this particular month can be structured in the following way:
Forecast analysis on product group level for frozen month:
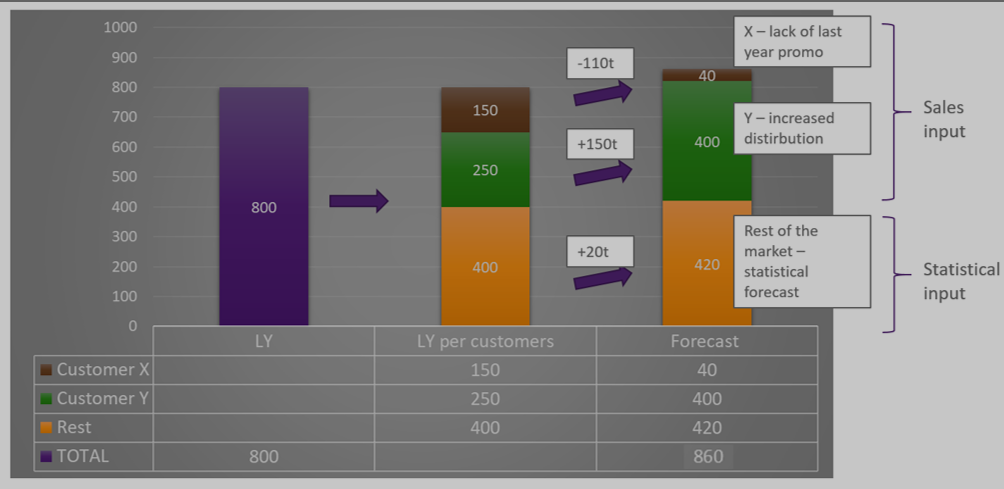
- The starting point for analysis can be last year’s figures (naïve forecast)
- Creation of building blocks – separation of 2 or 3 top customers with biggest events (in analogical period LY or planned for future) and rest of the market
- Revision and agreement on the forecast for each building block
- Aggregation of figures
Such an approach differs from the standard approach where segmentation is done according to product dimension. This higher-level approach can help Demand Planners to speak the same language as the Sales team which is oriented towards activities per customer. We can imagine a team of Key Account Managers and each of them comes to the meeting sharing details about their customer/channel. The above tool can be very useful in consolidating their input and challenging it with data (historical sales or statistical forecast).
Another benefit of the tool is easier estimation of promo uplift for particular customers (e.g. by finding periods of similar promotion in data). It is impossible to judge promo impact of a particular customer looking at data for whole market. Of course, the alternative is to deep dive into sales reports per customers.
High-Level Demand Review Process Steps
- Sales to prepare info of upcoming events by customer that will impact sales and prepare info about marketing campaigns/events
- Demand planning to analyze historical data, especially for focus month and recent trends
- Reviewing most important/volatile SKU’s.
- Revision of the forecast by product groups (see chart above) and agreement on final figures
The role of Demand Planning is to work out the optimum SKU mix. Commercial teams should not be involved in forecast revision SKU by SKU. However, if they are aware about events concerning single SKUs (e.g. recommendation at the cashier or new listing), the Demand Review meeting is the right place to deliver such information.
Summary
People and the underlying process are the foundation of effective S&OP, especially for companies that are just starting to implement it. This Excel tool can be a great support to start your S&OP journey. After building process maturity, investment in advanced systems can provide further results.