Business Efficiency Planning (BEP) works to align all functional areas around common business goals and enable and coordinate decision making to achieve the most efficient plan. To get there we need tools to help understand what decisions need to be made and when, and who needs to make them. Given the complexity of business, this often feels like finding a needle in a haystack.
Process mapping has been used by companies to help to identify bottlenecks by:
- providing visibility into how processes are carried out;
- identifying where the processes are executed;
- identifying who is doing what within the process;
- revealing how processes affect other processes;
- and determining why a process is being executed.
In much the same manner, Business Decision Mapping essentially makes the decision-making process visible, illustrating how and when decisions occur so they can be viewed, analyzed, and improved. With such an understanding, stakeholders can align their activities to achieve better execution, communication, and enhanced relationships—all of which help to make the decisions more aligned and better than it was before.
Business Decision Mapping Identifies Activities Within Each Process
First developed in Copenhagen with the help of Thomas Holm, a senior partner at Implement Consulting Group, Business Decision Mapping was designed to help take separate and sometimes competing processes, (such as FP&A and S&OP and PLM and ERM) and streamline them into an efficient business planning process. Using Thomas’s lean thinking and the goal of coordinated decision processes, the mapping process made it easier to identify activities within each process that are not adding value and then targeted them for elimination and/or assimilation into other processes.
Variations have been adapted and this mapping exercise has been used by executives for individual processes or as a launching step to a comprehensive Business Efficiency Planning process (BEP). In conducting a mapping process, we recommend these seven steps to make it easier. As experience tells us, each is crucial to achieving success and to better understand your organization’s decisions making process.
Step 1 (1 week ahead): Prepare Upfront
Start before the meeting and plan the ‘who, what and where’. This includes devoting some time to deciding who should participate in the session. A simple rule to apply here would be to choose the people who represent different functions involved in the decision-making process. Before the meeting, let people know how to prepare and begin thinking about all the strategic decisions they make weekly, monthly or annually, and even write some of them down. Decide on a suitable place. The mapping exercise should be conducted in a comfortable environment so that you can get the best output from the participants. Similar to a process mapping exercise, you will need a large whiteboard or empty wall you can add paper to, along with post-it notes and markers.
Step 2 (15 – 30 min): Explain The Process
The meeting facilitator should clearly outline the process and guidelines. Start the session with setting up goals, defining what kind of decisions you should focus on, what we mean by the time horizon and frequency of the decision, and the decision matrix. Also, set a time frame. Don’t let the meeting last forever. A good process should take approximately 3 hours and typically no more than 4.5 hours.
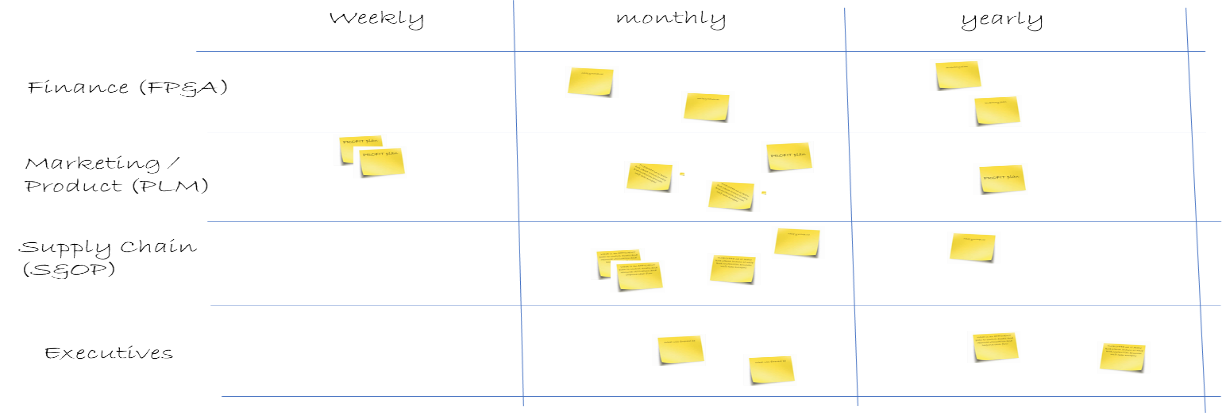
Either before the meeting or during this step, a decision matrix framework is created on a whiteboard or with paper on a wall. It usually has horizontal swim lanes corresponding to different functions or functional processes. Most common are finance and the FP&A process, Commercial and PLM process, supply chain and operations and S&OP process, and executive team and ERM or business review process. Vertically, the matrix is divided by the frequency of the decision, usually weekly, monthly, quarterly or annually. It is important we are not looking at the time horizon of the decision such as strategic decisions that impact 4 months out but only the frequency that decision is made. Time horizon is important for scope and it is recommended to only look at decision with time horizons of 3 months or longer where all other operational decisions should be just that-operational and part of day to day business.
| Weekly | Monthly | Annually | |
| Finance (FP&A) | |||
| Marketing / Product (PLM) | |||
| Supply Chain (S&OP) | |||
| Executives |
Step 3 (20 – 30 min): Jump In
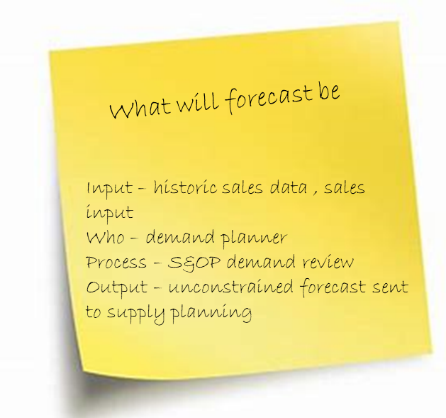
Before heading into groups, organizations should insist that each person first try to come up with their own thoughts and ideas of decision points. Start the process and have participants individually generate decisions that are made, write them down on post-it-notes and post them in the appropriate swim lanes or on a flipchart and then transfer ithem to swim lanes and the matrix. These can be any strategic decision over a 3 months horizon that impacts the business and planning process. It may be better to think of it as any recurring answer you have to give and word it as a question or decision point. What will the forecast be? It may be suitable with the right audience to not limit participants to their own sand boxes and allow them to brainstorm and add any decision they know is critical to whatever swim lane. When you have finished this step, you should have multiple decisions dotting your matrix with some duplicates and some you never considered.
Step 4 (30 – 60 min): Refine The List
As small groups of participants with functional expertise begin to clarify or justify decisions within your swim lane, removing duplicates or non-critical ones and moving any that happen at a different frequency. Add whatever remains beside or on the note, detailing the key input needed, who is making the decision, who may need the decision to be made, and the meeting it is made in or mechanism used to make the decision. Add as much detail you need or have in the time allotted. All of this helps in future steps but is not absolutely critical in this one and may be added later as well. Finally, you will notice obvious dependencies and linkages where you can begin to literally draw lines between notes or points and highlight similar decisions and inputs used for multiple places.
Step 5 (30 – 60 min): Prioritize
Now, arrange ideas and notes into logical groups such as similar timings, inputs or people. It is OK to decide together to move some of the notes around to help visualize the groupings-the sticky notes can be helpful here because you can easily rearrange them. Next, take all the decisions points and work on culling them to come up with the most critical ones to focus on. As a group, decide upon priorities for top decisions or groupings and on the order of importance. This does not mean you need to disregard the ones at the bottom of this list. This becomes a great opportunity to help identify overlap, gaps in timing and interdependencies and so on.


Step 6 (60 – 90 min) Strategize
Continue as a group to further group strategic decisions around cost, cash, service and process focus. For this, you are looking at what grouping the decision impacts the most. For example inventory safety stock levels is primarily a cash decision but has some cross over to service and cost. Some discretion on where they fall and some straddling is OK but make an effort to reach a consensus on specific categories. It is here that you also add any missing details for the top decisions with inputs to the decision, the who and where, and why we are making it. The final objective of this meeting is to decide what will happen next with the top decision points. Define the next steps for combining or improving the decision process – this may include steps such as presenting the ideas to senior management, gathering feasibility data etc.
Step 7 (post meeting): Create Your Roadmap
Outside of the meeting, create a list of opportunities for improvement around key decision points. Possibly outline a road map to combining strategic decisions into Business Efficiency Planning (BEP) core meetings and identity opportunities to eliminate waste and latency in the decision making process. Assess the impact on the organization’s meeting and decision flow design for the proposed changes. Share your findings with the group or wider audience to ensure consensus. This would also be the place to communicate the “low hanging fruit” where natural synergies can occur and make immediate changes. For the rest, and with the key decision points, develop a business case for implementation and improvements.
Whilst most people are familiar with the concepts of detailed and high-level process or value stream maps, many need clarifications on Business Decision Maps. Business decision mapping helps companies see how, when, and where key decisions are being made and improve the inputs and align them better to the organization’s strategy. Although its typical purpose is to streamline decisions and eliminate waste, business decision mapping can also be seen from the perspective of adding value. With inputs from the right people and in the right forum, it can add insights to make more informed and efficient business decisions, driving value and success in your company.