For many of us, the words “the forecast is always wrong” has become something we instinctively say. There’s nothing wrong with acknowledging there is variation in demand or admitting we may miss a projection. But when it becomes your automatic response to any miss and is believed to be an unavoidable part of forecasting, it is highly limiting. This seemingly harmless habit can actually lower the effectiveness of forecasts and the business’s confidence in them. What’s more, it justifies other people’s poor actions and focuses attention on the wrong things.
As Demand Planners, We Need To Give Ourselves More Credit
I cannot help but believe that when everyone constantly says that forecasts are always wrong, it needlessly creates guilt in the poor Demand Planner’s mind and undermines their self-esteem. It’s hard to feel good about yourself when you keep falling on your own sword.
Maybe we should stop saying we are sorry and stop saying forecasts are always wrong. Repeating this mantra also sends the message that you’d rather be agreeable than be honest, when in fact our job is not to provide a number but to offer solutions. We need to stop using the crutch of inevitable forecast error and start having honest conversations and focus on what we can predict and what we can control.
When others say “the forecast is always wrong” what they really mean is that demand variability is perfectly normal.
It Actually Is Possible To Be 100% Accurate
Yes, it really is. But let us start with what constitutes accuracy. Accuracy is the degree of closeness of the statement of quantity to that quantity’s actual (true) value. While I accept that one’s ability to create an accurate forecast is related to demand variability, an accurate forecast does not reduce demand variability. Demand variability is an expression of how much the demand changes over time and, to some extent, the predictability of the demand. Forecast accuracy is an expression of how well one can predict the actual demand, regardless of its volatility.
So, when others say “the forecast is always wrong”, what they really mean is that demand variability is perfectly normal. What we should be focusing on is that “while we can’t predict demand perfectly due to its inherent variability, we can predict demand variability” (Stefan de Kok). This is the difference between trying to precisely predict the exact point and accurately predicting a range or the expected variability.
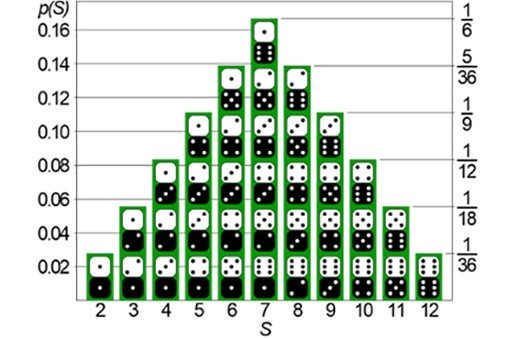
A common example of this is trying to guess the outcome of rolling two fair dice compared to accurately predicting the range of possible outcomes. For the throw of the two dice, any exact outcome is equally probable and there is too much variability for any prediction to be useful. But the different possibilities for the total of the two dice to add up to are not equally probable because there are more ways to get some numbers than others. We can accurate predict that 16.7% of the time the two dice will add up to seven, and we can predict the range of possible outcomes as well as the probability of each outcome. While we may not know exactly what will happen, we can exactly predict the probability of it occurring. And if you predict the outcome within the probabilities, guess what? You are correct. Even though 100% precise is not an option looking at ranges or probabilistic forecast, 100% accuracy most certainly is within the realm of possibilities!
Bingo! We have officially proven everyone wrong and have our 100% accuracy.
Accurately predicting an outcome within a range of probabilities is more valuable than trying to forecast a single number.
Range Forecasts Give Us So Much More Information Than Single Point Forecasts
Besides being able to more accurately predict the probabilities of outcomes and ranges, we are also providing more relevant and useful information. When you predict the variability, this not only grounds our initiatives in reality but also gives us the power to make better business decisions. One way to counteract variability is to ask for range forecasts, or confidence intervals. These ranges consist of two points, representing the reasonable “best case” and “worst case” scenarios. Range forecasts are more useful than point predictions.
With any single point forecast you are providing a single point of information which you know is not 100% correct. With a range you are providing four pieces of valuable information: we not only know the point or mean but we also know the top, the bottom, and the magnitude of possible variability.
Measuring the reduction in error rather than the increase in accuracy is more valuable to us because there is a stronger correlation between error and business impact than there is between accuracy and business effect.
It doesn’t take much to see that such a probabilistic forecast, or even just a forecast with ranges and a better prediction of uncertainty, is useful information in supply chain planning. Now we know how much variability we need to plan for and can better understand the upside or downside risk involved. In addition, accurately predicting uncertainty can add enormous value. That’s because you are focusing on improving not only the average demand prediction, but the entire range of possible demand predictions including the extreme variability that has the biggest impact on service levels.
Your KPIs For Measuring Forecast Error Are Based On A False Assumption
Part of the problem with saying we are always wrong is that we measure our performance ineffectively. This is because our definitions of forecast error are too simplistic or misrepresented. Many people look at forecast accuracy as the inverse of forecast error, and that is a major problem. Most definitions of forecast error share a fundamental flaw: they assume a perfect forecast and define all demand variability as forecast error. The measures of forecast error, whether it be MAPE, WMAPE, MAD or any similar metric, all assume that the perfect forecast can be expressed as a single number.
I mentioned above that we can provide more information in a range of forecast probabilities and subsequently be more accurate. All we need now is a way to measure this and prove it. A metric which helps us measure the accuracy and value of these types of forecasts is Total Percentile Error (TPE). Borrowing Stefan de Kok’s definition, TPE “measures the reduction in error – rather than the increase in accuracy – since there is a stronger correlation between error and business impact than between accuracy and business effect.” For more detailed information about this calculation see Foresight Magazine’s Summer 2017 issue.
Nassim Nicholas Taleb described this type of forecast accuracy measurement in his book, The Black Swan. He explains the difference in measuring a stochastic forecast (using probability distributions) and more traditional approaches (using a single point forecast). He states that if you predict with a 20% probability that something will happen (and across many instances it actually happens 20% of the time) that the error is 0%. Naturally, it would also need to be correct for every other percentile (not just the 20 percentile) to be 100% accurate.
Bingo! We have officially proven everyone wrong and have our 100% accuracy.
You need to stop using the crutch of inevitable forecast error and start honest conversations about what we can predict and what we can control.
Focus On The Process
Even though we should know there is no such thing as being“wrong”, we should still look at what we are measuring and incentivize the right behavior. Mean Absolute Percentage Error (MAPE) or Mean Percentage Error (MPE) will tell us how much variability there is and the direction, but they do not tell us if the Demand Planning process is adding value. The question shouldn’t be whether we are right or wrong, but whether the steps we are taking actually improve the results. And if so, by how much.
Forecast Value Added (FVA) analysis can be used to identify if certain process steps are improving forecast accuracy or if they are just adding to the noise. When FVA is positive, we know the step or individual is adding value by making the forecast better. When FVA is negative, the step or individual is just making the forecast worse. [Ed: for further insight into FVA, see Eric’s guide to implementing FVA analysis in your organization.]
The obvious advantage to focusing on these types of metrics and KPI’s is that we are not casting blame but discovering areas of opportunities, as well as identifying non-value added activities. By eliminating the non-value adding steps or participants from the forecasting process, those resources can be redirected to more productive activities. And by eliminating those steps that are actually making the forecast worse, you can achieve better forecasts with no additional investment.
I Beg Of You, Please Change Your Vocabulary!
At the end of the day, our goal is not necessarily to be precise but to make a forecast more accurate and reliable so that it adds business value to the planning process. We need to stop saying we are sorry for what is out of our control and start controlling what we know is possible. To do this, we must not only change our vocabulary but also change the way we are doing our jobs.
Most people are fixed on traditional forecasting process and accuracy definitions. The goal is for you to start thinking in terms of the probability of future demand. From there, you need to be the champion inside your organization to help others understand the value of what forecasts provide. You need to stop using the crutch of inevitable forecast error and start honest conversations about what we can predict and what we can control.