
As a three-time S&OP process owner in a couple of Fortune 100 manufacturers, I’m painfully aware of how difficult it is to achieve a good working S&OP process, and how even more difficult it is to sustain it. Why is it so difficult? In this discussion, we’ll delve into why it’s so difficult to achieve and sustain the process, and introduce a few not so familiar impact issues, such as uncertainty, complexity, and risk. We’ll structure the conversation within a solid frame of reference, using the original AMR Maturity Model, which I feel is still valid, and then highlight three very mature methodologies, which are key risk mitigation strategies that can and should be exercised in AMR’s Stage 3 of the their S&OP Maturity Model, ultimately producing substantial benefits to the bottom line.
Remember, our discussion revolves around the supply chain and the S&OP process operating in a global environment. With that said, there are more and more sources of uncertainty, complexity, and risk within our supply chains and the S&OP process.
Why? First, our companies are growing top line revenue in areas of the globe where they’ve never operated before and, to support that growth, our supply chains and S&OP processes are experiencing more frequent risk events every day. Second, as our supply chains grow, they are becoming increasingly complex. Why? We have too many SKUs, too many plants, too many suppliers, too many independent agents behaving poorly on our behalf, too many product life cycles, too many ways to interact with customers, and more. Third, more and more countries are imposing additional taxes, tariffs, rules, and regulations on world trade and as we grow our supply chains; thus, the number of our inventory choke points has increased, leaving us more susceptible to risk events. With that as our backdrop, we’ll focus our attention on Stage 3 of AMR’s S&OP Maturity Model — Collaboration. In this stage, where only about 20% of companies reside, the goal is completely different than the first two stages. In Stage 3, the goal of the S&OP process is profitability! In this stage, S&OP teams leverage collaboration across the enterprise, exercise “What-if” scenario planning, shape demand, inject risk into the dialogue, and begin to utilize our techniques that we’ll touch on throughout this discussion. And finally, we cite a couple seminal studies on product proliferation and supply chain complexity, which came out in 2011. One study by Appleseed Partners & Open Sky Research provided these revealing statistics.
[bar group=”content”]
- 56% said one of the Top 3 pain points was — too many products for their resources.
- 45% said they manage product portfolios with spreadsheets.
- Only 11% said they constantly monitor/or stop producing under-performing products/SKUs!
And the other study by PRTM, now under PWC, came up with these key observations from 350 worldwide companies.
- 85% stated they expect complexity to grow significantly over the next three years.
- 75% expect an increase in number of international customers.
- 66% expect a higher number of product variations to fulfill customer requirements.
PRTM articulated this parting thought after the study.
Most participants are looking to international customers for future market growth. Yet few are prepared for the complexity that results from serving global customers with regionally customized products.
All these raise the question — how do we mitigate these risks? Below are three risk mitigation strategies.
NO. 1 | RISK MITIGATION STRATEGY: PRODUCT PORTFOLIO MANAGEMENT
With this data in mind, we can dig into our first of three mitigation methodologies that can improve profitability and mitigate risk. We talk about the propensity of companies to expand products and the inability to cull underperforming SKUs. Over many years of experience and through many studies, a few key statistics stand out across just about all industries.
- About 20% of products account for about 80% of revenue and about 82% of contribution margin.
- About 60% of revenues are generated by 8% of products.
- About 45% of products contribute only 5% of revenue.
Why is this so prevalent within our product portfolios? We operational professionals, by observation and experience, are very good at introducing new products and getting products out the door at cost and with good delivery service. What we don’t do well is get rid of what APICS-Supply Chain Council calls, “Zombie SKUs”. These are products that suck the oxygen out of the entire portfolio. These SKUs are corpses of what used to be good and pro table products. With that said, let’s walk through a typical pattern of product proliferation.
Executives at a company posit the business plan that states: “We’ll drive an increase in top line revenue by increasing differentiation across diverse categories,” meaning we will add products. So, what happens after that game plan begins? Figure 1 provides a glimpse.
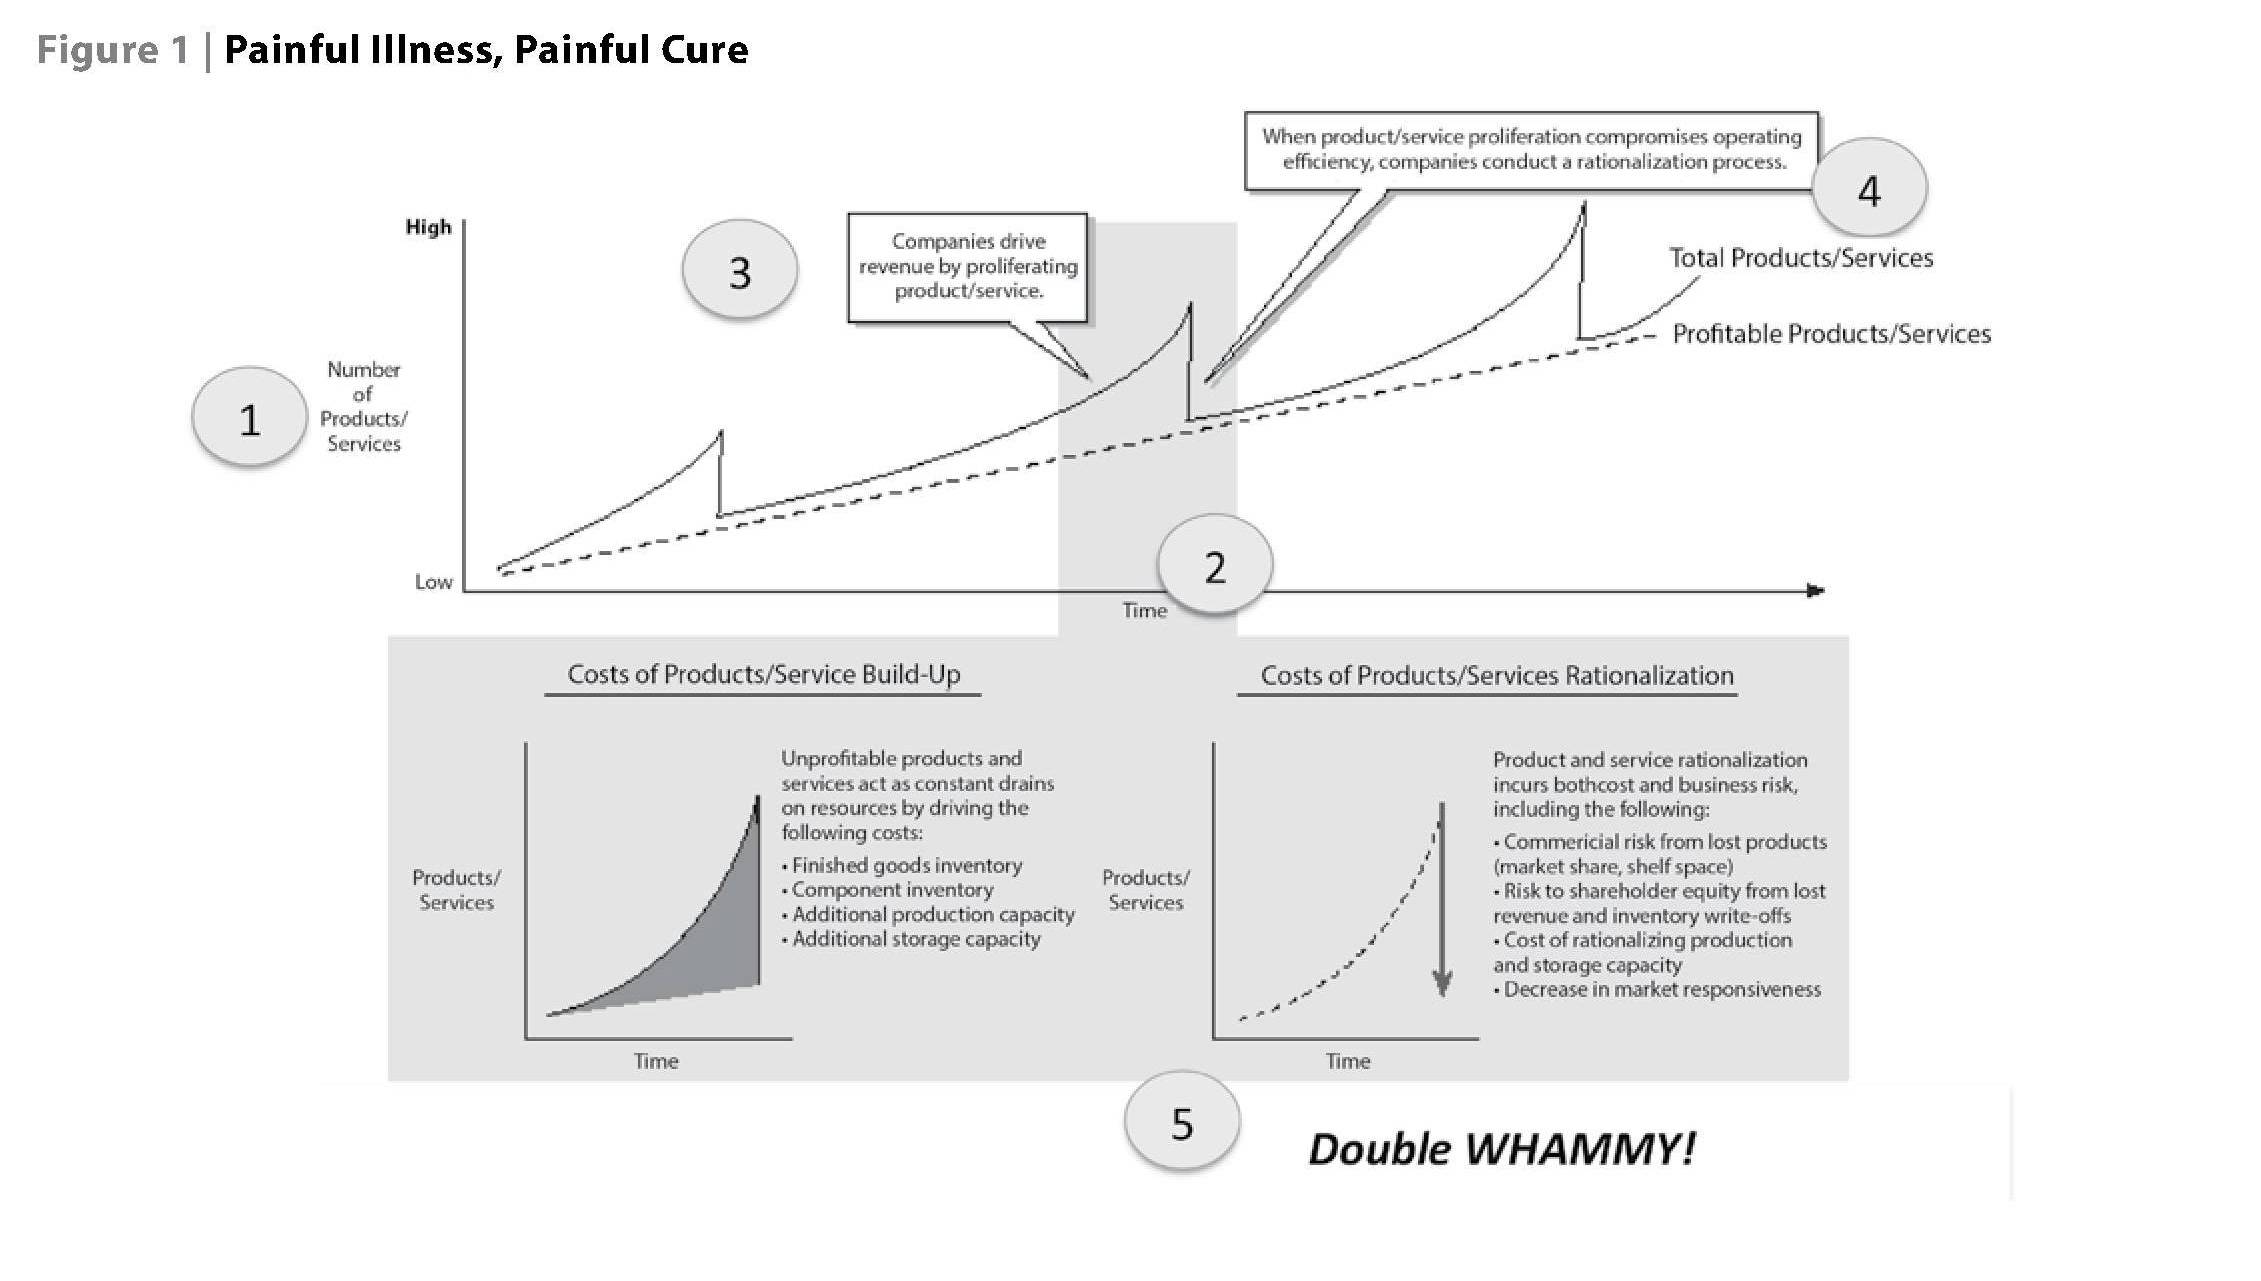
Here on the “Y-Axis” we maintain the number of products from low to high, and on the “X-Axis” we have Time. As you can see in the graph, over time, organizations begin to proliferate products and services. The additional costs to exercise this game plan are:
- More finished goods, raw and component inventory, and additional product capacity and warehouse space.
- When product proliferation begins to compromise operating efficiency, companies conduct a rationalization program. When companies exercise this strategy in support of the game plan, they experience “The Double Whammy!” They now incur still more costs such as commercial risk from lost revenue and share, risk to shareholder equity, write-off costs, costs for rationalizing production and warehousing.
The bottom line is product proliferation, as a strategy, is fraught with financial and strategic risk and must be fully vetted before embarking on that plan. How does a company mitigate this risk? One approach is to utilize Gross Margin Return on Inventory Investment (GMROII). GMROII has been used by many industries that manage a large number of products and services. It can be used to determine the amount of gross profit earned for each dollar invested in inventory on an annual basis. The methodology does have its critiques, but it’s a very good and somewhat simple way to begin the dialogue about under performing SKUs. Figure 2 profiles the calculation, the analysis and the Mitigation Game Plan.
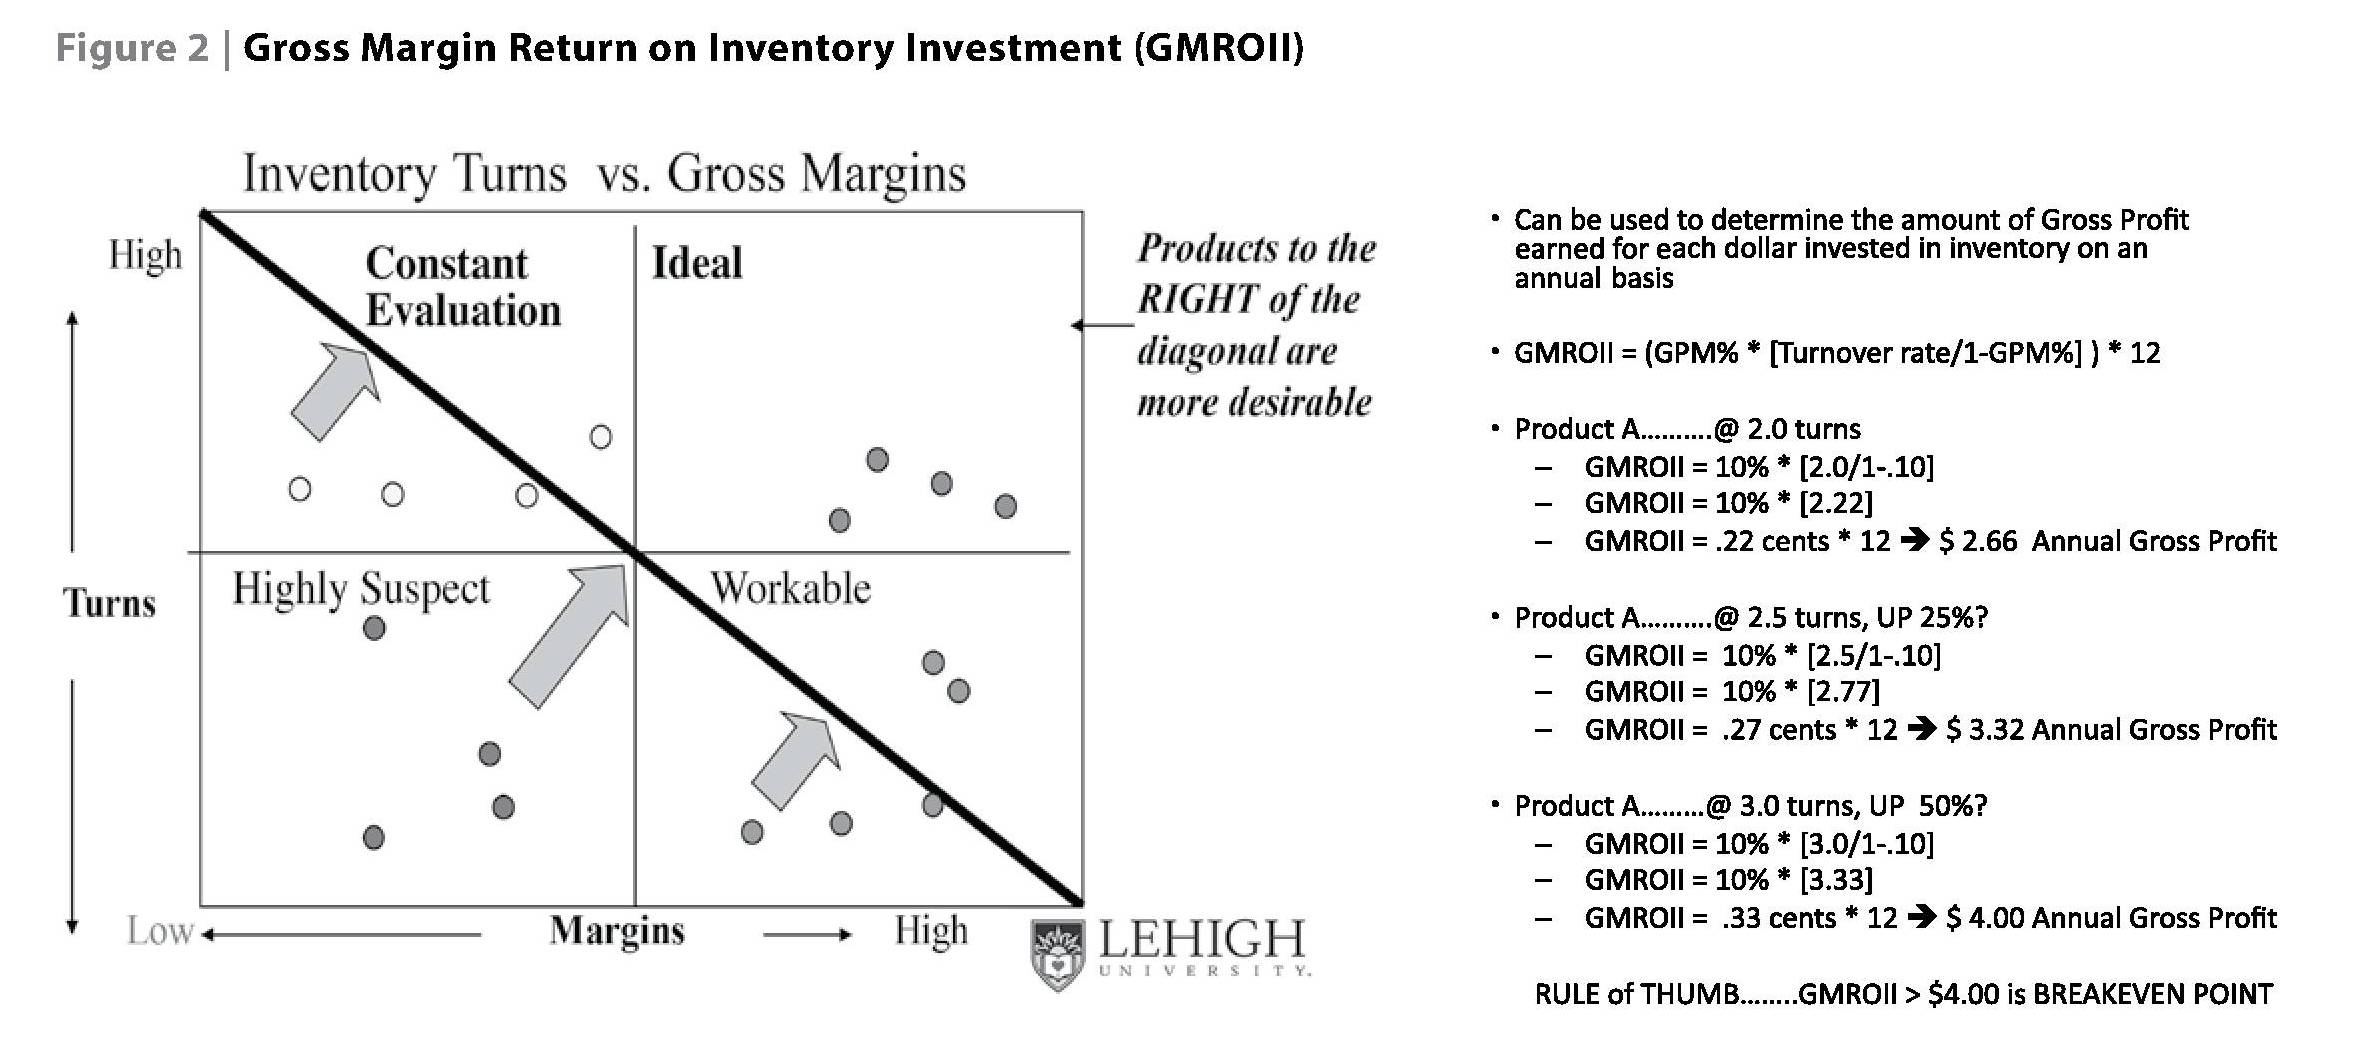
As you can see, all that is needed for the analysis is the product’s Gross Margin percent and its ongoing Inventory Turnover Rate. The example goes through three different scenarios with the same product. On an annual basis, a product’s Gross Margin is somewhat stable, so the what-if analysis takes place by “tweaking” the product’s inventory turns, either through lowering the operating inventory, safety stock, or ordering parameters. Therefore, if a company can improve the inventory turns, it can improve the GMROII. Many organizations that utilize GMROII tend to plot every SKU in a category or all SKUs on a 2×2 grid. On the left side of Figure 2 we have that grid.
- On the “Y-Axis”, we have the Inventory Turns from low to high.
- On the “X-Axis”, we have the Gross Margin from low to high.
- Once the SKUs are plotted on the grid, we can begin the analysis of SKU evaluation and improvement.
The grid categories are: Highly Suspect, Workable, Constant Evaluation, and Ideal SKUs. The Net-Net of the GMROII exercise is a very quantitative and visual approach to differentiating SKUs and continually evaluating the status of “Good versus Not-So-Good” products, based on their margin contribution and asset impact. This exercise and approach tends to lead to a very logical and less emotional approach to continuous SKU evaluation and perhaps rationalization. The “Rule of Thumb” for GMROII break-even is more than $4.00 annually.
One final note, P&G, the nation’s largest consumer product company, is presently dumping about 90 of its smaller, less popular brands. This was announced in late 2014. The company has maintained about 160 brands. The 90 brands being discontinued represent about 56% of their brand portfolio and about 10% of their revenue. The remaining brands account for about 90% of their ongoing revenue. Sound familiar? At the announcement, their CEO, A.G. Lafley, stated: “We’re going to create a faster growing and more profitable company that is far simpler to manage and operate”. Shares of P&G jumped more than 3% after the announcement, but share price still remained slightly lower for the year. Sound familiar?
NO. 2 | RISK MITIGATION STRATEGY: CUSTOMER VALUE MANAGEMENT
Our second of three risk mitigation methodologies is what we call Customer Value Management (CVM). Our bold statement out of the blocks is: “About 20% of all customers generate 80% of the profits!” This statement is backed up as well with many real- life experiences and multiple studies. The real tragedy here is: “Only about 5% of all companies segment their customers!” Looking at this still another way, almost all companies treat every customer the same, which normally means one or maybe two delivery approaches. This is not an efficient or effective way to deliver goods. Why is this prevalent? Because segmenting or just talking about rationalizing or “Firing” a customer is a very emotional issue. Sales and marketing professionals tend to get “wedded” to their customers. So, with that as a backdrop, how do we move forward with this risk mitigation and profit improvement methodology?
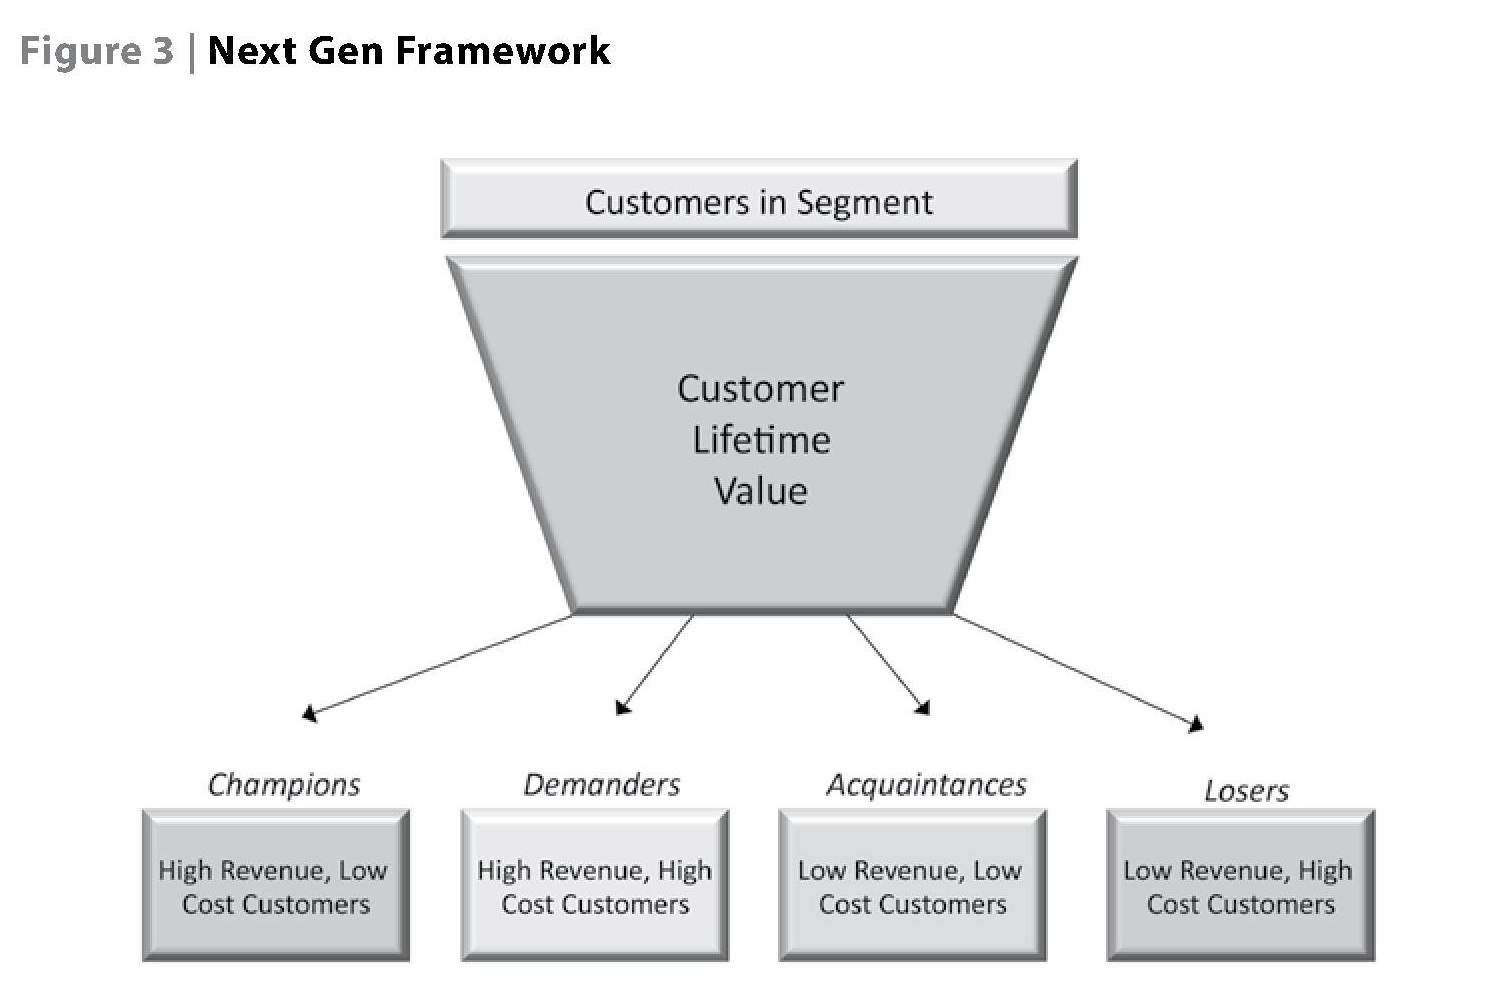
Over the years, many companies with exemplar supply chain strategies, including IBM, have embraced this approach. Not initially, but normally in a timeframe such as Stage 3 of the S&OP process. Customer Segmentation is driven by lifetime value to the organization. The most often used methodology is to segment customers into four categories. Those categories tend to be 1) Champions, 2) Demanders, 3) Acquaintances, and 4) Losers. Figure 3 depicts these segments.
How do we go about defining value to these categories? The Supply Chain Risk Consortium maintains several complex templates, methodologies, and more. It’s not an easy thing to accomplish and that’s why only a few companies exercise the process. We don’t have the time to dig deeper here but we can provide a few helpful hints in terms of “what to do” to better align these customers with their contribution to the bottom line. Several aspects of the segmentation process revolve around: Price Points, Technical Product Issues, Logistics Services, Quality, Collaboration, Self Service, and Distribution. The value segmentation revolves around “What to Do and How to Do it!” Some quick-hit thoughts on that are below.
- Champions
- What to Do: “Nurture” them.
- How: Through preferred customer programs, loyalty programs, personal support, and more.
- Demanders
- What to Do: “Grow and Reduce Cost”
- How: With focused marketing, increased volume, providing incentives, and improving customer service.
- Acquaintances
- What to Do: “Grow Revenue”
- How: Stimulate volume through up-selling, cross-selling, bundling, or promotions.
- Losers
- What to Do: “Improve Profitability”
- How: Minimize direct customer care, invoke additional charges for services, minimize direct marketing.
Once a company embarks on the “Improve Profitability” aspects of S&OP by critically reviewing their product portfolio and by segmenting their customer base, they are ready to exercise the third leg of this process: plotting SKUs and customers, enhancing the bottom line and mitigating risk.
NO. 3 | RISK MITIGATION STRATEGY: TOTAL COST TO SERVE MODEL
Our third of three methodologies ties it all together. Figure 4 depicts how this is accomplished. Sometimes called Complexity Management, analytically driven portfolio segmentation schemes can be used to allow companies to effectively manage complexity and free up capacity to serve more profitable customers and products. We’ll touch more on this in the next section. Let’s walk through the graph.
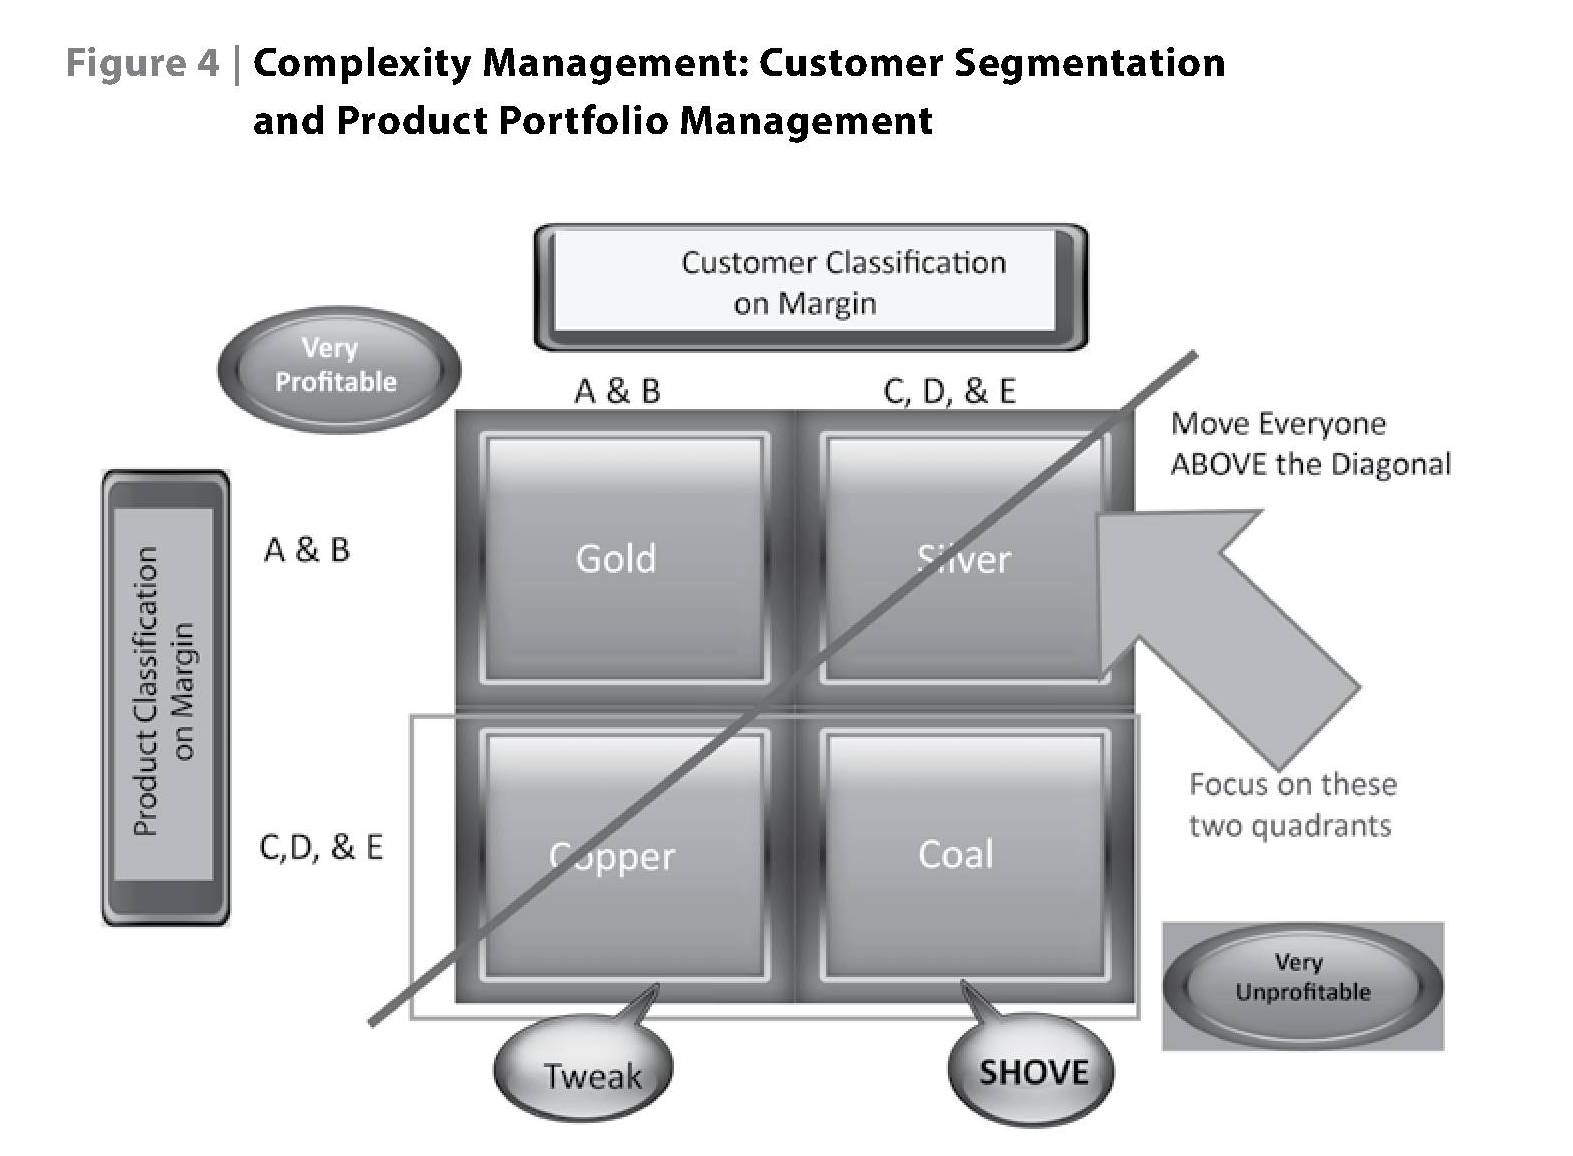
The graph depicts a methodology to identify, classify, and plot customers and products.
- On the “Y-Axis” we maintain Product or SKU classification by margin from low to high.
- On the “X-Axis” we maintain Customer classification by margin as well from high to low, left to right.
- The first quadrant, top-left section, maintains A&B type products and A&B customers — “The Good Guys.”
- The second quadrant, top-right,maintains A&B products and C, D, & E type customers — “The Not-So-Good Guys.”
- The third quadrant, bottom-left, maintains C, D, & E type products and A&B type customers — “Marginal Products and Good Customers”.
- The fourth quadrant, bottom-right, maintains C, D, & E products and C, D, & E type customers — “Marginal Products and Marginal Customers”.
After all SKUs and customers are plotted, the fun begins! The dialogue normally starts with products and customers within the bottom two quadrants. Companies review those inside what we call “The Copper” quadrant and attempt to “tweak” both the products and customer profiles, as we discussed in the earlier sections. Next, the dialogue focuses on “The Coal” quadrant. These are the very unprofitable products and loser customers! The approach tends to be to shove those into one of the other quadrants. If that can’t be done, then hard decisions must be made for the good of the bottom line. Ultimately, the graphic approach allows everyone visibility, and acts as a very good vehicle to make strategic, tactical and operational business and risk mitigation decisions.
BENEFITS TO BE DERIVED
As we mentioned at the outset, companies take this approach to improve profitability and mitigate supply chain risk. Think about it this way. When a company eliminates very “Marginal Products and Loser Customers,” what happens? It tends to free up capacity and resources to make more A&B type products for more A&B type customers. Empirical studies show companies that enact formal portfolio management processes have reported, Earnings-Before-Interest-Taxes (EBIT) performance improvement of 3 to 6 points. Typical EBIT improvements have been in:
- Cost to Serve reductions of 1-2 points
- Capital Improvement of 1-2 points
- Increased Net Pricing of 1-2 points
Example No. 1: A consumer products company with 5,000 customers and 500 products — with 57% SKU reduction got equivalent to $7.5 M margin improvement.
Example No. 2: A healthcare manufacturer with 5,400 products — with 26% SKU reduction got equivalent to a 4000% Internal-Rate-of-Return (IRR).
The benefits are quite impressive. The tools, techniques, templates, and methodologies are available, perhaps not within your company at this time, but it begs the point of taking a good hard look, especially if you are managing an S&OP process across a global supply chain landscape, and want to mitigate your supply chain risk and improve your bottom line. Enjoy your journey.
As published in the Winter 2015-2016 issue of the IBF’s Journal of Business Forecasting (JBF). All Rights Reserved.
Meet Gregory Schlegel at IBF Academy 2016 in Las Vegas, where he will be leading sessions on “Predictive Business Analytics & BIG Data,” as well as “Mitigating & Managing Risk within the S&OP Process.”