
 Interviewer: Michael Gilliland, SAS
This month’s interview is with Steve Morlidge of CatchBull.
Steve has 30 years of practical experience in designing and running performance management systems at Unilever, and is the author of Future Ready: How to Master Business Forecasting. His book is aimed at a general business audience, although he has also written extensively in journals on forecastability, FVA and other technical subjects. Steve is the creator of ForecastQT, a forecasting performance management application in the Cloud, which exploits the insights and innovations described in his articles.
I asked Steve about the application of FVA analysis with his clients.
Mike: What forecasting performance metric(s) are you using?
Steve: Our goal is to measure forecast performance in a way that provides a rigorous measure of the value that forecasting adds compared to the alternative – which is simple replenishment based on prior period actual demand. Consequently we measure error at the level, frequency and lag that reflects the replenishment process, which is usually very detailed.
Our key metric is Relative Absolute Error (RAE) based on the ratio of absolute error to the naïve error, since this tells us how much better the forecast is than simple replenishment and also allows for forecastability, in a way that conventional metrics like MAPE do not.
Mike: In comparing performance to a naïve model, what are your findings?
Steve: Although there are other benefits (e.g. simplicity, no judgmental input, allowing for forecastability, etc.) we compare forecast error to the naïve forecast error because it mirrors the performance of simple replenishment and so the most meaningful comparison that can be made.
Typically we find that most businesses struggle to beat the performance of the naïve forecast by more than 10-15% and that 40-50% of low-level forecasts perform worse than the naive and so destroy value – a huge potential performance gain, once addressed.
Mike: Are you measuring forecast bias? What are your findings?
Steve: Our approach involves decomposing the RAE measure into its two constituent parts – bias (the result of systematic under or over-forecasting) and variation (unsystematic error – relative to the naïve forecast) as they impact the business in different ways and have different causes requiring different solutions.
Most often we find supply chain forecasts are over-forecast on aggregate. But measuring this at the most granular level usually reveals significantly higher over-forecasting AND under-forecasting, that is hidden by the process of aggregation – and would be missed by traditional metrics like MAPE
Mike: What FVA comparisons are you making?
Steve: ForecastQT does not produce forecasts; it provides the analytics layer that continuously measures their performance (however they are produced). This provides a rigorous, scientific measure of value added along with the tools to help identify the source and cause of issues.
We find that statistical forecasts rarely escape judgmental intervention and we provide users with the ability to differentiate between the contribution of judgment and statistical methods to value added.
Mike: What FVA analyses / reports do you use? Can you share any examples?
Steve: We are able to measure value added in terms of avoidable error and cost and then analyze it across any dimension – product, channel or geography – thereby focusing effort where there is the greatest scope for improvement.
The sample chart above shows 5 product groups ranked according to forecast quality – as measured by the Value Added Score (VAS). Although it does not have the best forecast (ranked third with a VAS of 16) B80085 adds the most value (21k). But it also has the most SKU’s with critically high levels of bias or variation (as shown by the alarmed value of 75k), so this is where we should focus our attention. This chart also shows that no single product group beats the VAS for a simple statistical benchmark forecast (bVAS) indicating that there are problems with the forecast process as a whole in this business.
Mike: Have you developed any other new ways to conduct FVA analysis or report the results?
Steve: A recent innovation is the use of rectangular tree maps (aka “tile charts”). This data visualization tool enables us to see the impact of avoidable forecast error at multiple levels in a hierarchy in a single glance.
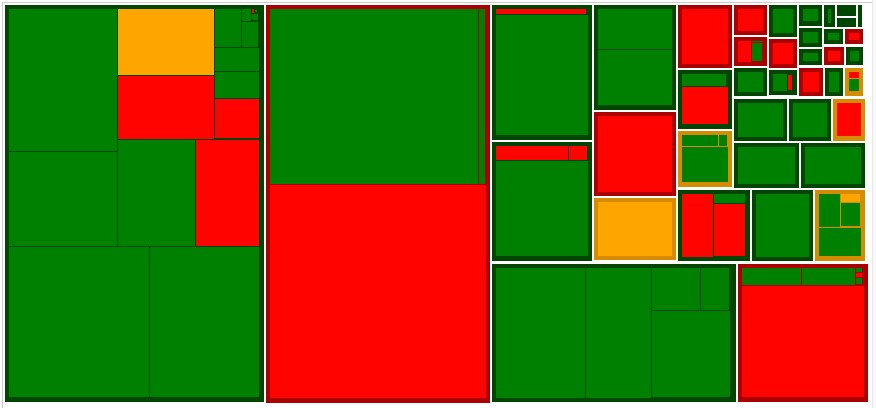
In this example the large tiles show Product Groups and the smaller tiles are the SKUs within them. The size of each tile indicates the amount of avoidable error and the colour whether this level of error is statistically significant. The largest red tiles represent the biggest improvement opportunities
Mike: Have you done any volatility analysis (e.g. “comet chart”), or otherwise attempted to assess “forecastability”?
Steve: Since the naïve forecast error is a measure of the volatility of demand (and its forecastabililty) our methodology explicitly incorporates this perspective.
Mike: Has FVA been adopted as a key performance indicator at your clients?
Steve: Because it is easy to understand what it means and what needs to be done to improve it, we find that most users start their forecast improvement journey by tackling bias. Users with a more sophisticated understanding of the forecast process and senior executives who are only interested in the impact of forecast performance on the business are the biggest fans of the value added approach.
Mike: Can you point to any specific benefits from using FVA at your clients?
Steve: Typically we uncover the potential to double the value added by forecasting.
Mike: Are there any process changes as the result of the FVA findings?
Steve: Where our value added methodology flags up forecasts that destroy value, we usually find these are products with relatively stable demand being forecast with overly complex methods and inappropriate judgmental overrides. Conversely exceptional performance is often associated with volatile demand and well-judged interventions.
Ironically, because metrics like MAPE do not allow for forecastability, this is often the exact opposite of the picture presented by traditional measures.
Mike: How do you advise setting forecast performance goals?
Steve: The goal should be set to improve value added continuously until it becomes uneconomic to go further. Fortunately, where value is being destroyed it is usually possible to improve performance by doing less.
Mike: Anything else you’d like to say about FVA? Including advice for other companies considering the application of FVA?
Steve: Forecasting is, arguably, one of the largest hidden sources of waste in modern businesses. REL (a Hackett Group company) estimates that over $1 trillion of unnecessary inventory is tied up in the balance sheets of the top US companies (worth 7% of GDP) and that poor forecasting is the biggest single contributor to the problem.
Unlike conventional approaches to performance measurement, adopting a value added perspective helps to expose the problem and engage management in efforts to make improvements. What we find is that there is no software silver bullet. Making headway depends on identifying and relentlessly chasing down the source of problems and adopting a measured, rational approach to process design and method selection.
Willing to share your experiences with FVA? Please contact the IBF at info@ibf.org to arrange an interview for the blog series.