
Recently Eric Wilson, CPF , Director of Global Demand Planning and S&OP at Tempur Sealy International delivered an IBF Webinar on Risk Mitigation, Forecast Value Added (FVA) and Demand Planning Segmentation Strategies. Below are some of the Questions & Answers that took place with Eric.
Q: What is Forecasting Value Added (FVA) and how is it calculated?
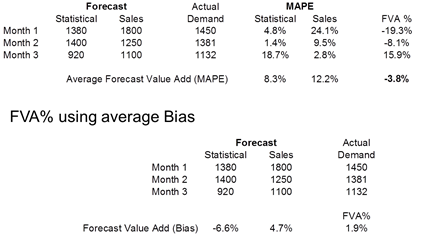
FVA% (Forecast Value Added) is considered the change in a forecasting performance metric that can be attributed to a particular activity in the forecasting process. In management speak, it is are we doing better / worse or adding value to a process step? It may be measured at any point in a forecasting process that adjusts or changes the forecast which may include lags or time horizons but also may be inputs, comparative to a base statistical or naive, or even aggregation (going from month to weeks). FVA simply is the change in error before and after a touch point or change in forecast due to process (see below). For one analysis, we may compare the baseline model forecast error to the collaborative forecast error to determine the effectiveness of market intelligence.
Q: Where do the judgmental and causal inputs come from in collaborative forecasting?
We have a formalized monthly and weekly forecasting cycle. In that we are all tied across the organization to a single forecast and number. In this process, we are not asking sales or others to forecast, but to contribute to that process. Everything starts with a baseline and adjustments are made up or down to that baseline and measured at each touch point (FVA%). Our inputs come from a variety of sources including sales, marketing, channel leaders, brand management, customers, management, and even supply &operations. Many causal inputs come from these sources as well as our own planners’ expertise and insights into the data. What we strive to do is find the best and most efficient inputs to our process, which is part of the logic for segmentation.
Q: Do you segment further within the quadrant?
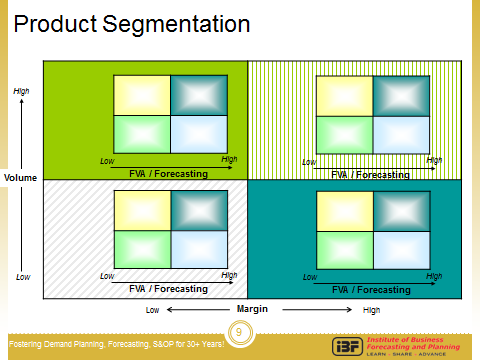
Yes, I did not show it, but typically we will also plot inside each quadrant, a revenue and margin matrix. This is especially important in the bottom right quadrant in the image below (High FVA% and Low Error). Collaborative Forecasting can and should be considered as a variable or input in most areas, but within this one we have found it more important to examine the margin returns of planners or other input to the time and contribution requirements. In other words, high revenue, high margin, or critical items justify more time and resources even if the return is a marginal single percent. On the other hand, low value almost commodity type items such as stable products may fall into this quadrant with lower forecasting error, but spending a lot of time or resources to gain 1% or 2% is not value added to the overall process.
Hear Eric Wilson speak @IBF’s
Business Planning & Forecasting: Best Practices Conference w/ Leadership Forum
Disney’s Yacht & Beach Club Resort
Orlando, Florida USA
October 26-29, 2014